Subtract COGS and Your No. 1 Product Changes — But Not If You Stop at Gross Profit
Ranking products by revenue and by gross profit produced what was essentially the same list (rank correlation 0.99). The

Ranking products by revenue and by gross profit produced what was essentially the same list (rank correlation 0.99). The order only flipped once we went down to contribution margin (0.58). The No. 2 product by revenue came dead last out of 14 on contribution margin, and the No. 3 product by revenue ranked No. 1. What made the difference wasn’t COGS — it was the ad spend attached to each product.
Public research data + sample data from a commerce brand · 12-month window · approx. 270,000 orders / approx. 134,000 purchasers · 187 SKUs with sales. For every section, we also note the Laplace screen and settings where you can see that number.
The figures in this report are not real transaction data; they are illustrative values generated to reflect the distribution of Laplace benchmark metrics. They do not represent any specific customer, so please use them to understand trends rather than as absolute values.
PART 01 · First — Which screens to open
You don’t need to look at every menu. We picked only the screens that produce the numbers in this report.
| Menu | Screen | Which number in this report | Priority |
|---|---|---|---|
| P & L Analysis | Margin Rate / Contribution Margin Rate | Contribution margin rate by product; the ranking flip | Priority 1 |
| Product Analysis | By Product | The product list to set against the revenue ranking | Priority 1 |
| Data Management | Base product · COGS Registration | The precondition for this report — COGS match rate | Priority 1 |
| Data Management | Ad–Product Matching | The rules for attaching ad spend to products | Priority 1 |
| Product Analysis | By Option | Contribution margin gaps created by quantity options | Priority 2 |
| P & L Analysis | P&L by Channel | Break-even ROAS that differs by channel | Priority 2 |
| Ad Analysis | By Ad Channel · By Campaign | Actual ROAS by product | Priority 2 |
| Custom Dashboard | Product 4-Quadrant Chart | Sorting cash cows, hidden gems and phase-out candidates | Priority 2 |
| P & L Analysis | CAC | Checking a product’s role before phasing it out | Priority 3 |
Only one row needs to be built from scratch
PART 02 · Half of your revenue ranking barely makes any profit — the numbers research has confirmed
Before looking at our own data, let’s set a baseline. How unevenly profit is distributed across products has been measured at scale.
| Study | Confirmed figures |
|---|---|
| Strategy& (PwC), CPG portfolio analysis | About 28% of all SKUs generate 80% of cumulative gross profit, while about 35% of SKUs contribute virtually nothing to profit. The bottom 50% of SKUs produce less than 5% of margin |
| Deloitte Retail Profitability Study | On a fully loaded cost basis including returns, packaging and shipping, 62% of e-commerce SKUs are loss-making |
| McKinsey retail projects (Assortment Optimization) | Retailers that cut low-profit SKUs kept 90–95% of revenue while improving gross margin by 2–4pp |
| McKinsey “The Power of Pricing” | A 1% price improvement lifts operating profit by about 8%. To offset a 5% discount through volume, unit sales must rise by 18.7% |
| Modern Retail, SKU rationalization at an oat-drink brand | SKU rationalization lifted the Asia margin from 19.2% → 23.4% |
In other words, “the products that sell well” and “the products that make money” are two different lists. The problem is that most brands only have the first one.
So far, these are other people’s numbers
Next screen — Research only goes as far as “each SKU contributes differently to profit.” It doesn’t tell you how far down the revenue ranking you need to go before that difference shows up.
PART 03 · Priority 1 — Rankings flip at contribution margin, not at gross profit
Brand A is a Korean skincare brand. It sells serums, creams and ampoules through its own store, major platforms and marketplaces. Over 12 months, 187 of its 199 registered SKUs generated sales.
Before reading the numbers
Where to look in Laplace — P & L Analysis › Margin Rate / Contribution Margin Rate
How to set it up
-
Set the date range to 12 months — so that a single seasonal product can’t shake up the ranking.
-
Set the dimension to Product. If you choose Option, each quantity option becomes its own row and the ranking gets fragmented.
-
Turn on all three metrics: revenue · gross profit · contribution margin. With only one of them on, you won’t see this section’s conclusion.
-
Confirm that you’re using net sales after refunds and claims. Revenue before those adjustments overstates products with high return rates.
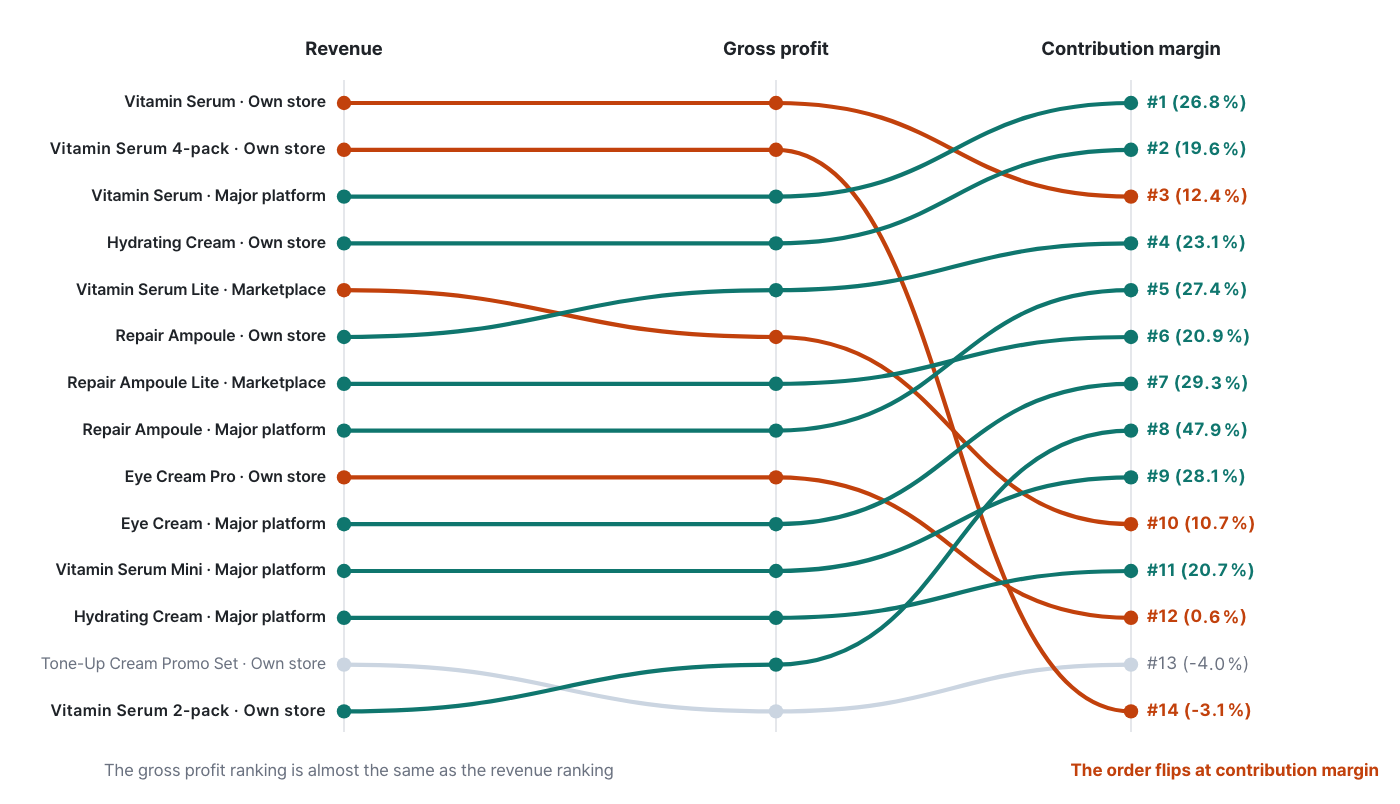
| Revenue rank × gross profit rank | Revenue rank × contribution margin rank | Average rank shift | Overall contribution margin rate |
|---|---|---|---|
| 0.99 | 0.58 | 0.3 → 3.1 places | 21.1% (gross margin 68.6%) |
| Revenue rank | Product · Channel | Revenue index | COGS % | Fees % | Shipping % | Ad spend % | Gross profit % | Contribution margin % | Contribution margin rank |
|---|---|---|---|---|---|---|---|---|---|
| 1 | Vitamin Serum · Own store | 100.0 | 31.4 | 6.8 | 6.1 | 43.3 | 68.6 | 12.4 | 3 |
| 2 | Vitamin Serum 4-pack · Own store | 81.6 | 30.2 | 5.4 | 10.8 | 56.7 | 69.8 | -3.1 | 14 |
| 3 | Vitamin Serum · Major platform | 67.2 | 30.6 | 27.4 | 0.0 | 15.2 | 69.4 | 26.8 | 1 |
| 4 | Hydrating Cream · Own store | 63.5 | 38.7 | 2.9 | 5.4 | 33.4 | 61.3 | 19.6 | 2 |
| 5 | Vitamin Serum Lite · Marketplace | 45.1 | 31.9 | 19.8 | 1.1 | 36.5 | 68.1 | 10.7 | 10 |
| 6 | Repair Ampoule · Own store | 42.8 | 25.3 | 4.6 | 6.9 | 40.1 | 74.7 | 23.1 | 4 |
| 7 | Repair Ampoule Lite · Marketplace | 40.3 | 24.8 | 20.2 | 2.0 | 32.1 | 75.2 | 20.9 | 6 |
| 8 | Repair Ampoule · Major platform | 32.6 | 24.5 | 27.9 | 0.0 | 20.2 | 75.5 | 27.4 | 5 |
| 9 | Eye Cream Pro · Own store | 29.1 | 22.6 | 3.1 | 6.2 | 67.5 | 77.4 | 0.6 | 12 |
| 10 | Eye Cream · Major platform | 23.7 | 23.2 | 25.6 | 0.0 | 21.9 | 76.8 | 29.3 | 7 |
| 11 | Vitamin Serum Mini · Major platform | 22.8 | 32.7 | 27.8 | 0.0 | 11.4 | 67.3 | 28.1 | 9 |
| 12 | Hydrating Cream · Major platform | 16.9 | 39.1 | 25.4 | 0.0 | 14.8 | 60.9 | 20.7 | 11 |
| 13 | Tone-Up Cream Promo Set · Own store | 14.3 | 33.8 | 2.9 | 5.8 | 61.5 | 66.2 | -4.0 | 13 |
| 14 | Vitamin Serum 2-pack · Own store | 14.1 | 31.6 | 5.5 | 6.2 | 8.8 | 68.4 | 47.9 | 8 |
Revenue index: No. 1 product = 100. Contribution margin rate = 100 − COGS rate − fee rate − shipping rate − ad spend rate (based on net sales excluding VAT).
How to read the numbers
-
The gross profit ranking is the same list as the revenue ranking. Rank correlation 0.99, average shift 0.3 places. That’s because COGS rates don’t vary enough to change the order — in this table they cluster between 22.6% and 39.1%. If you stop at gross profit and say “we look at things on a profit basis,” you are effectively still looking at revenue.
-
The first flip happens at contribution margin. Rank correlation 0.58, average shift 3.1 places. The No. 2 product by revenue drops to No. 14 (last) on contribution margin, while the No. 14 product by revenue climbs to No. 8.
-
What flipped the ranking wasn’t COGS — it was ad spend. The same table contains a product whose ad spend is 8.8% of net sales and another at 67.5%. The max–min gap in COGS rate is 16.5pp, while the gap in ad spend rate is 58.7pp.
-
Loss-making products sit near the top of the revenue ranking. The No. 2 and No. 13 products by revenue have negative contribution margins. Looking only at the revenue ranking, both of them are “doing well.”
Next screen — We now know the ranking flips. What we can’t see yet is where each 100 won of revenue flows to make that happen.
PART 04 · Breaking down 100 of revenue — how gross profit and contribution margin differ
Where to look in Laplace — P & L Analysis › Margin Rate / Contribution Margin Rate
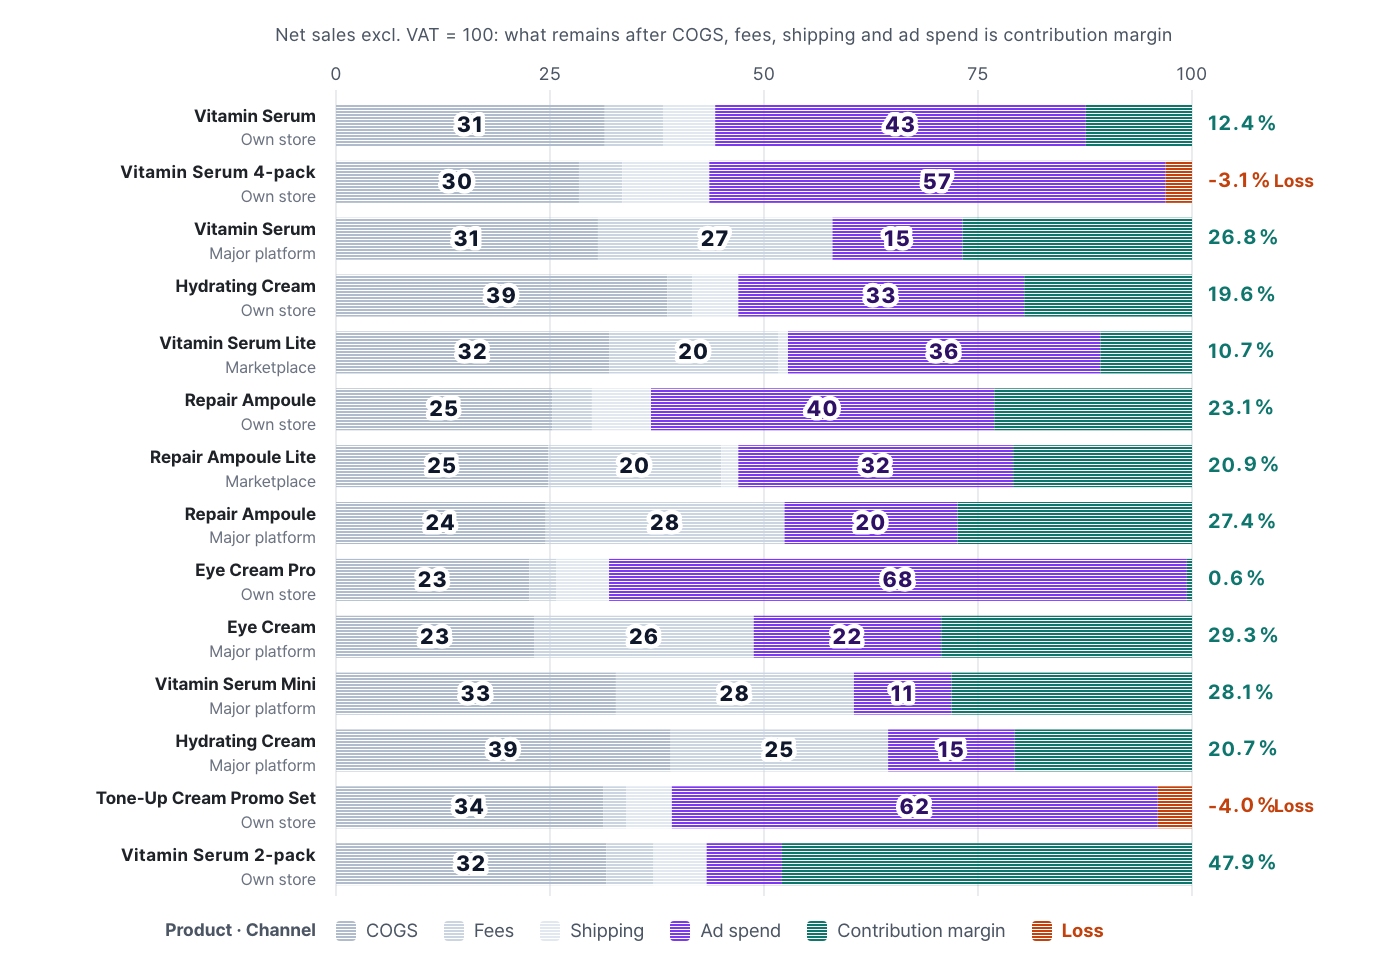
The difference between the two metrics — how much you subtract
How to read the numbers
-
Overall, gross margin is 68.6% and the contribution margin rate is 21.1%. The 47.5pp in between goes to fees (12.3%), shipping (3.4%) and ad spend (31.8%). The single biggest cost isn’t COGS — it’s ad spend.
-
The same product has the opposite cost structure on different channels. On the own store, fees are thin and ad spend is heavy; on major platforms, fees are heavy and ad spend is thin. The combined contribution margin rates may look similar, but the items you can cut are different.
-
A product with a 0.6% contribution margin rate ranks No. 9 in revenue. Ad spend climbed to 67.5% and ate up almost all of its 77.4% gross margin. It succeeded at selling, but nothing was left over.
Next screen — Every number so far rests on the assumption that the table is accurate. In reality, it’s more common for the table itself to be skewed.
PART 05 · Pitfalls — skip these three checks and every table above is wrong
Please follow this order. If you put this section off, you’ll end up trusting the previous section’s numbers at face value.
Pitfall ① The same product is split across multiple product names
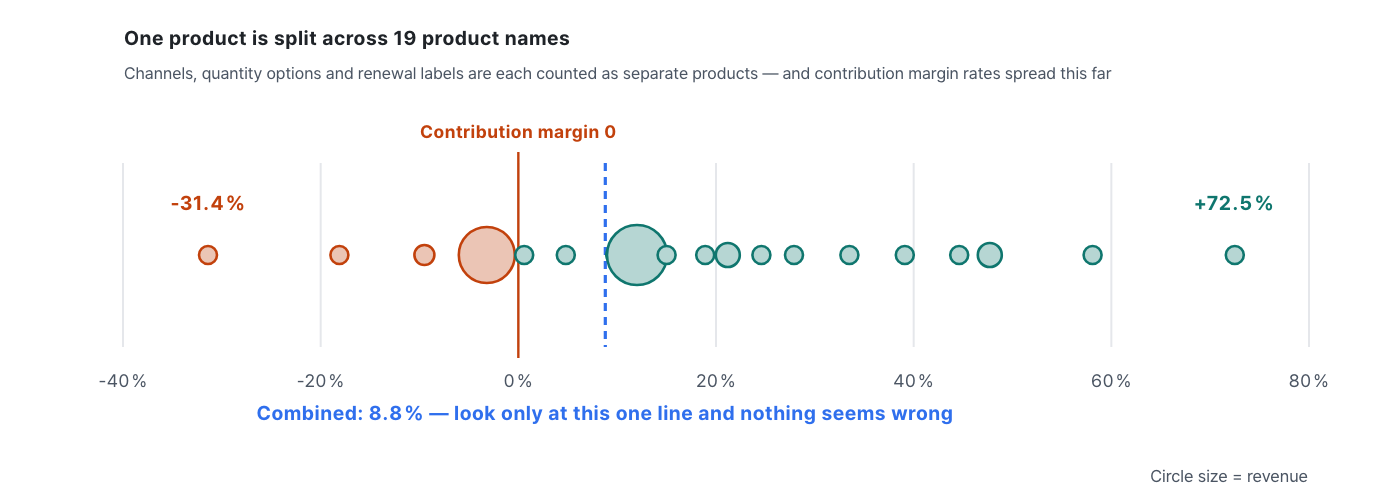
Different product names per channel, quantity options (1-pack/2-pack/4-pack) and pre/post-renewal labels are each captured as separate products. At Brand A, one product was split across 19 product names, and their contribution margin rates ranged from -31.4% to +72.5%. Combined, it’s 8.8% — and looking at that single line alone, nothing seems wrong.
How to check
-
In Data Management › Base product, see how many products the same item is registered as.
-
Look at the product axis (Base product) and the sales axis (channel products) separately. Roll up on the product axis and you see how good the product really is; spread out on the sales axis and you see problems with how it’s sold.
-
Look at quantity options separately in Product Analysis › By Option. 2-packs and 4-packs are usually repeat-purchase volume sold without ads, so their contribution margin rates are much higher.
Pitfall ② If you don’t attach ad spend to products, you get a fake contribution margin
If you only manage ad spend as a lump sum, the PART 03 table becomes identical to the gross profit table — you end up calling a table with a 0.99 rank correlation “contribution margin.” Conversely, if you look at contribution margin by channel without knowing the allocation rules, you’ll be wrong in the opposite direction.
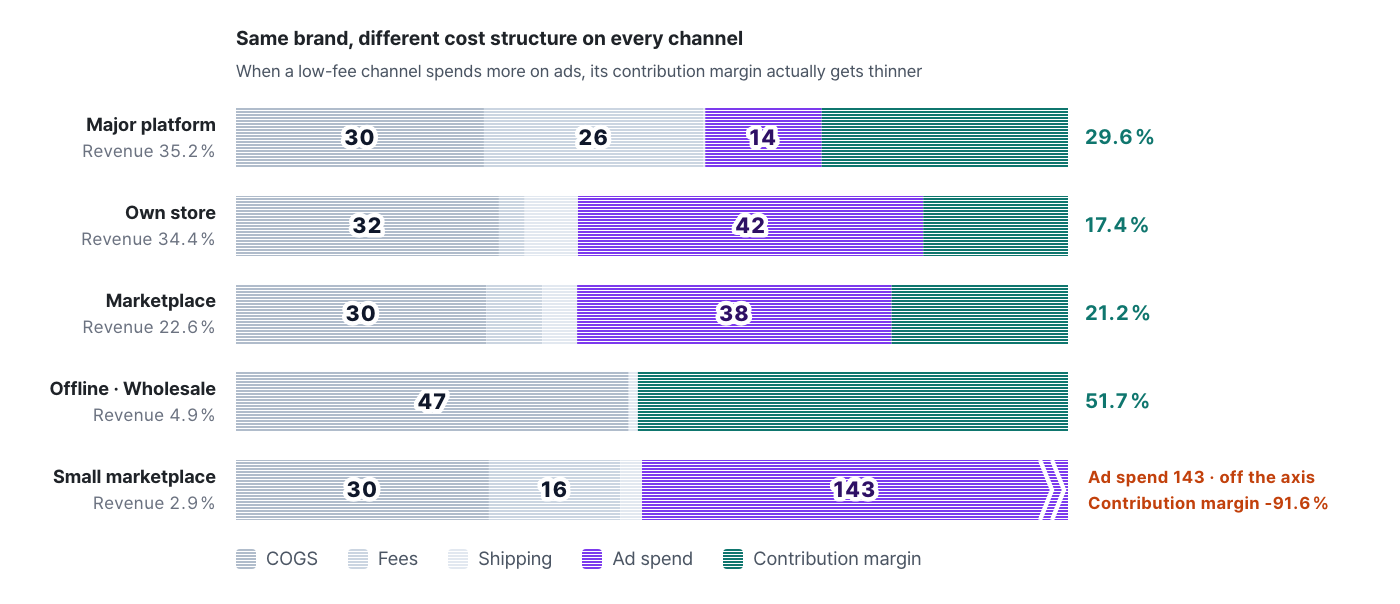
| Channel | Revenue share % | COGS % | Fees % | Shipping % | Ad spend % | Contribution margin % | Break-even ROAS | Actual ROAS |
|---|---|---|---|---|---|---|---|---|
| Major platform | 35.2 | 29.8 | 26.4 | 0.2 | 14.0 | 29.6 | 2.29x | 7.14x |
| Own store | 34.4 | 31.6 | 3.1 | 6.4 | 41.5 | 17.4 | 1.70x | 2.41x |
| Marketplace | 22.6 | 30.1 | 6.7 | 4.2 | 37.8 | 21.2 | 1.69x | 2.65x |
| Offline · Wholesale | 4.9 | 47.2 | 0.0 | 1.1 | 0.0 | 51.7 | 1.93x | No ads |
| Small marketplace | 2.9 | 30.4 | 15.8 | 2.6 | 142.8 | -91.6 | 1.95x | 0.70x |
The small marketplace’s −91.6% does not mean the channel is bad
Pitfall ③ Products without COGS attached have inflated profits
Products whose COGS isn’t matched are calculated as having zero COGS and show up with a 100% gross margin. If such a product is a top seller, the entire profit margin gets inflated.
| Check item | Threshold | If you fall short |
|---|---|---|
| Product ↔ COGS match rate | 95% or higher | Unmatched products count as zero COGS → profit overstated |
| Ad ↔ product match rate | 95% or higher | Products with no ad spend attached look better than they are |
| Seller-paid shipping registered | Registered per channel | Contribution margin of own store and small channels overstated |
| Refunds and claims reflected | Net sales basis | Products with many returns overstated |
It doesn’t have to be perfect
Next screen — The table is now trustworthy. Next, we decide which box each product goes into.
PART 06 · Decision ① Reshaping the portfolio — the 4-quadrant view
Where to look in Laplace — Custom Dashboard › Product 4-Quadrant Chart
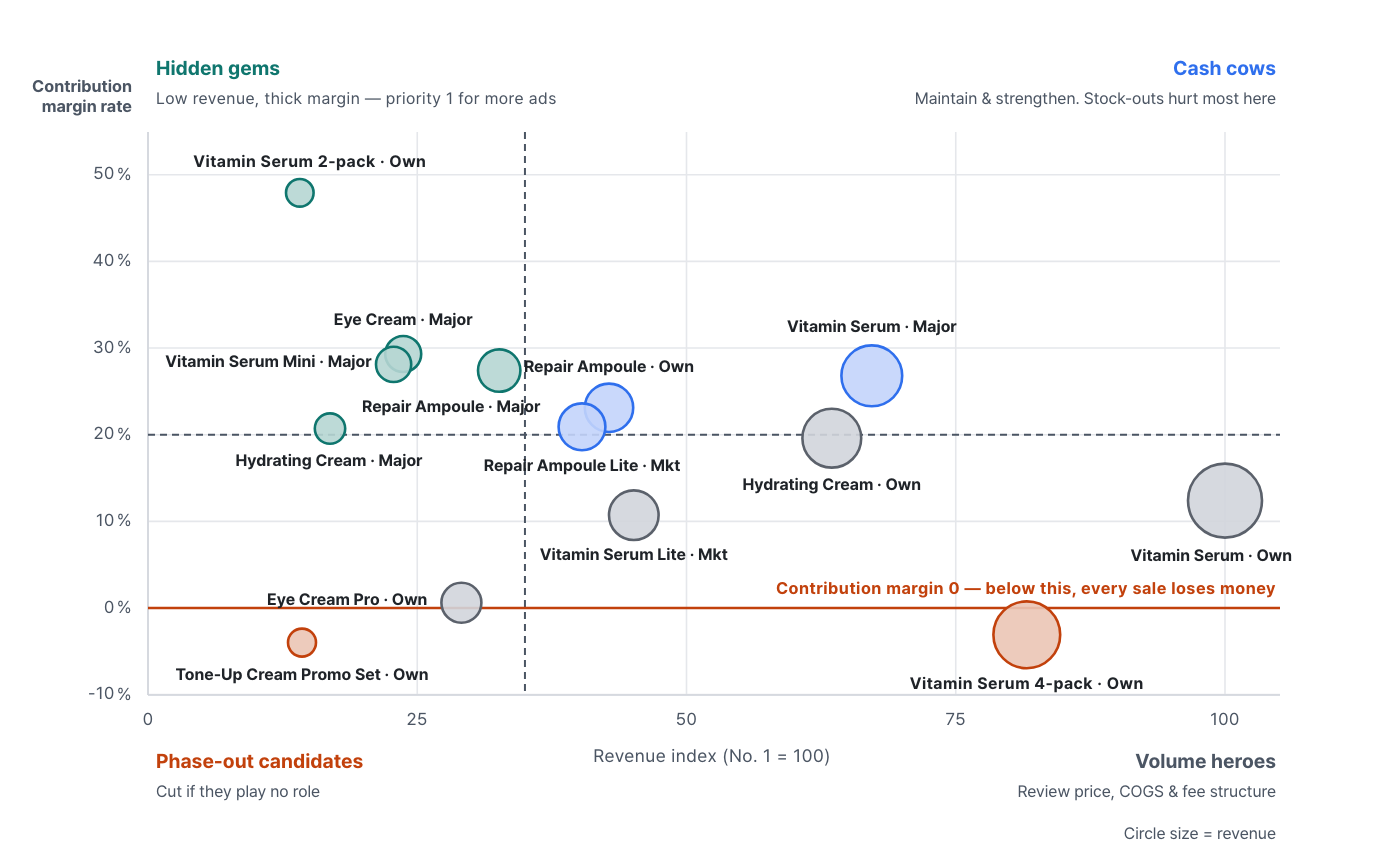
| Quadrant | In this sample | What to do |
|---|---|---|
| Cash cows (high revenue · high margin) | 3 products · 25.3% of revenue · 38.0% of contribution margin | Maintain and strengthen. Stock-outs hurt this group the most. It’s also the group to test whether ad spend can be reduced |
| Volume heroes (high revenue · low margin) | 4 products · 48.9% of revenue · 28.4% of contribution margin | They generate half of revenue but contribute less than that to profit. Review price, COGS and fee structure. Keep them if they serve as traffic drivers |
| Hidden gems (low revenue · high margin) | 5 products · 18.5% of revenue · 34.0% of contribution margin | First in line for a bigger ad budget. They generate a third of profit from a fifth of revenue |
| Phase-out candidates (low revenue · low margin) | 2 products · 7.3% of revenue · −0.4% of contribution margin | Candidates for SKU rationalization. But check their role before deleting them — see the callout below |
Don’t cut everything just because its contribution margin rate is low
Next screen — We’ve decided which products deserve more ad spend. What we don’t know yet is how much is safe to put in.
PART 07 · Decision ② Ad budget — break-even ROAS differs by product
Where to look in Laplace — Ad Analysis › By Ad Channel · By Campaign
Break-even ROAS = 100 ÷ (100 − COGS rate − fee rate − shipping rate)
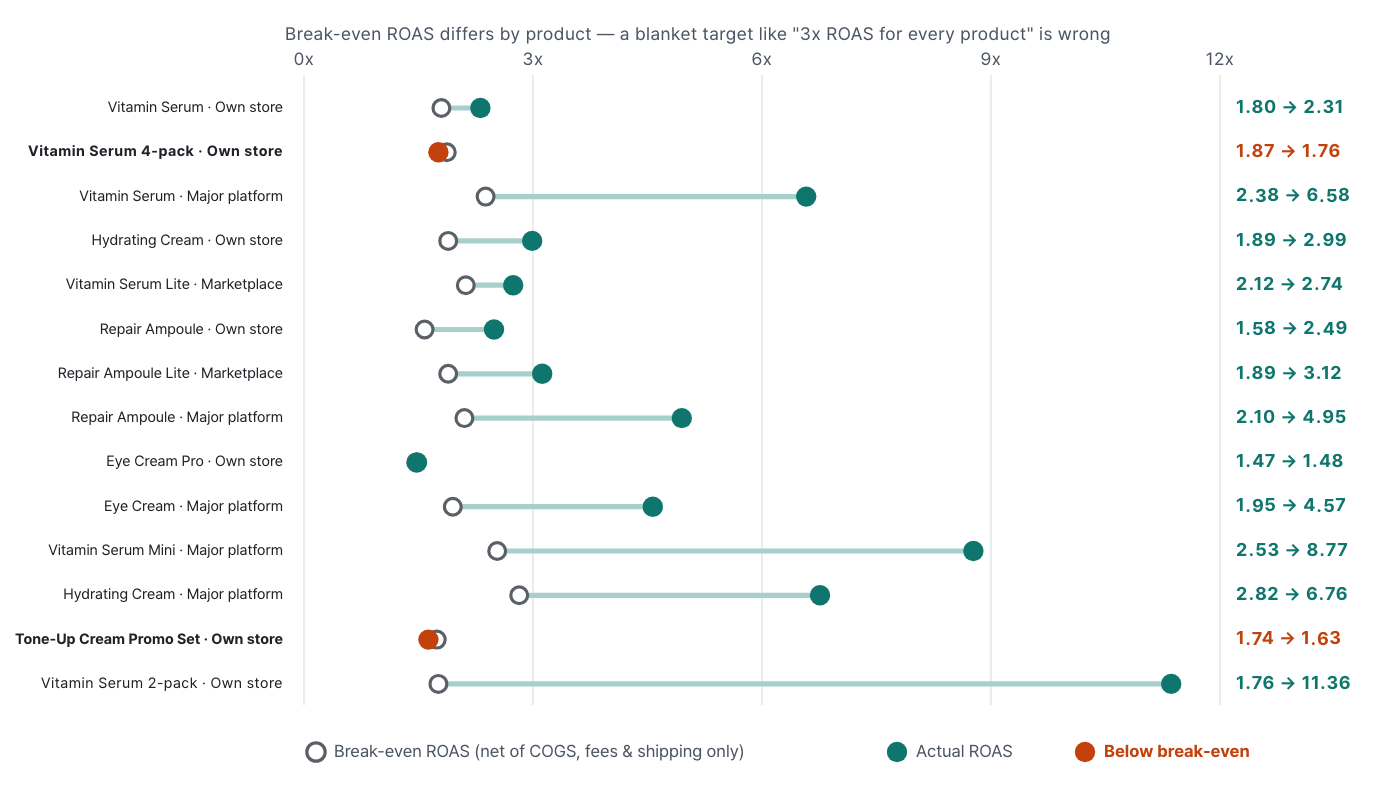
| Break-even ROAS range by product | Overall average break-even ROAS | Break-even ROAS by channel |
|---|---|---|
| 1.47–2.82x | 1.89x | 1.70–2.29x (own store to major platform) |
How to read the numbers
-
A blanket target like “3x ROAS for every product” is wrong. In this sample, the baseline ranges from 1.47x to 2.82x. Give everything a single target and you’ll cut ads on some products that are actually profitable while continuing to burn money on others that are losing it.
-
Channels shouldn’t share one target either. Own store 1.70x, major platform 2.29x — because their fee structures differ. Giving every channel the same ROAS target is the most common mistake.
-
If you rank by contribution margin instead of ROAS, the order shifts a little. But when COGS rates are clustered in a narrow band, as at this brand, the two orders don’t differ much. The wider the spread of COGS rates at a brand, the more ROAS and actual profit diverge in ranking.
Next screen — The ad budget is set. The remaining lever is discounting.
PART 08 · Decision ③ Discount limits — the ceiling is the contribution margin rate
A blanket discount like “20% off everything” pushes thin-margin products into the red. You need contribution margin rates by product to set discount limits by product.
| Contribution margin rate | Example from this sample | Discount limit | With a blanket 20% discount |
|---|---|---|---|
| 45% or higher | Vitamin Serum 2-pack (47.9%) | Plenty of room | 27.9% still left after the discount |
| 25–30% | Eye Cream · Major platform (29.3%) | Up to 25% | 9.3% after the discount — thin, but profitable |
| 10–20% | Vitamin Serum · Own store (12.4%) | Up to 10% | −7.6% loss |
| 0% or below | Vitamin Serum 4-pack (−3.1%) | No discount | Already loss-making before any discount |
Discounting is a far more expensive tool than you think
PART 09 · Decision ④ SKU rationalization — raise margins while protecting revenue
Where to look in Laplace — P & L Analysis › Margin Rate / Contribution Margin Rate
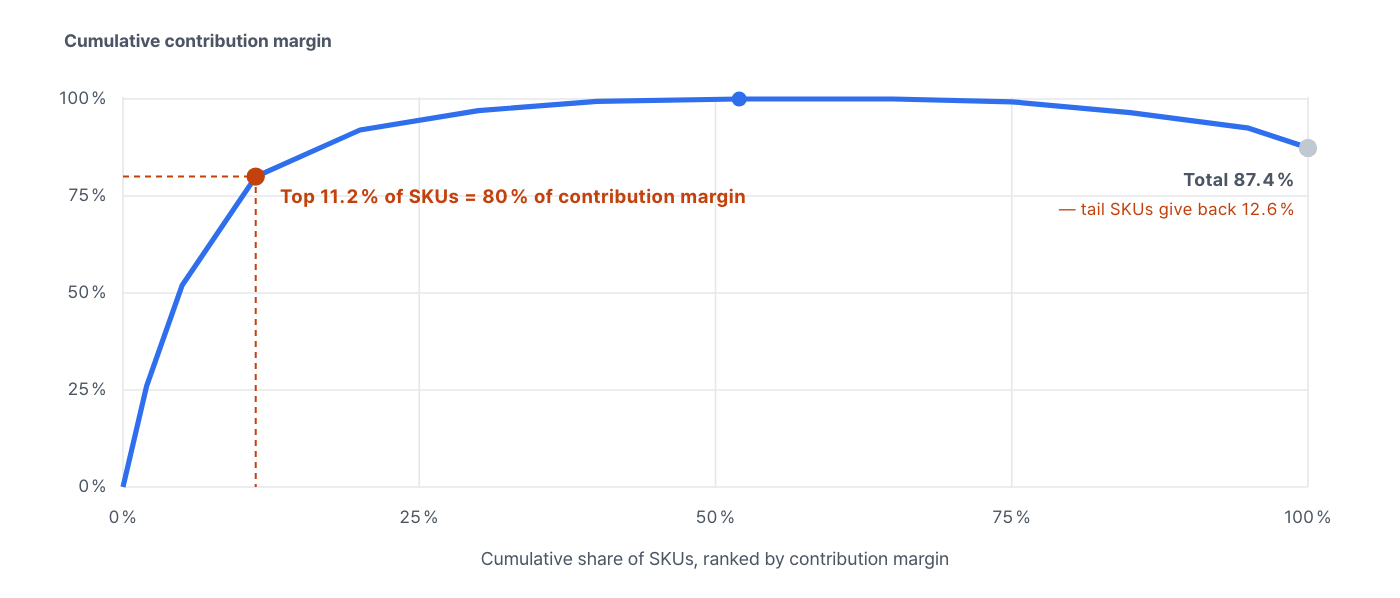
| SKUs generating 80% of contribution margin | SKUs with negative contribution margin | Revenue share of those SKUs | Revenue / contribution margin of the bottom 50% of SKUs by revenue |
|---|---|---|---|
| 21 SKUs (11.2%) | 34 SKUs (18.2%) | 17.6% | 0.9% / 0.5% |
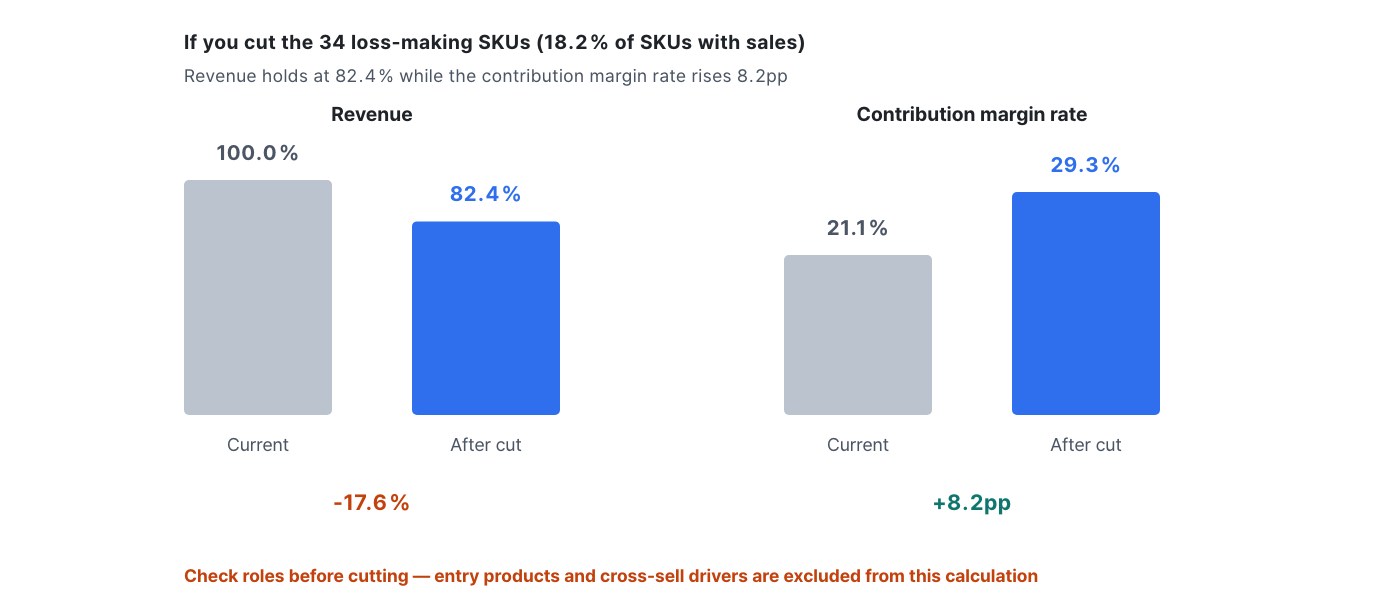
How to read the numbers
-
21 SKUs generate 80% of contribution margin — that’s 11.2% of SKUs with sales. Even more concentrated than the 28% reported by Strategy&.
-
The cumulative curve rises above 100% and then falls back to 87.4%. That means the SKUs at the tail give back 12.6% of the profit earned up front. It’s a shape you will never see in a revenue ranking.
-
Cutting the 34 loss-making SKUs lifts the contribution margin rate from 21.1% → 29.3% (+8.2pp) while keeping 82.4% of revenue. That’s a bigger jump than the “90–95% of revenue retained, 2–4pp margin improvement” McKinsey observed — because some of the loss-makers carry a large share of revenue.
-
The bottom 50% of SKUs by revenue generate only 0.9% of revenue and 0.5% of contribution margin. This is the easy zone for rationalization decisions — but what you save here isn’t profit; it’s operating costs, inventory and your team’s time.
4-week action plan
| Week | What to do | Done when |
|---|---|---|
| W1 | Fill in the data — don’t analyze anything yet. Match COGS in Data Management › Base product · COGS Registration, match ads in Ad–Product Matching, and register seller-paid shipping | COGS match rate 95%+ · ad match rate 95%+ |
| W2 | Pull the product table from P & L Analysis › Margin Rate / Contribution Margin Rate and place the revenue ranking and contribution margin ranking side by side. Flag products with large rank gaps | List of products that moved 3 or more places |
| W3 | Build the 4-quadrant chart. For phase-out candidates, check their role using P & L Analysis › CAC and Strategy Design › Cross-Selling | Final lists of cash cows · hidden gems · phase-out candidates |
| W4 | Calculate break-even ROAS and discount limits by product and apply them to your ad accounts and promotion calendar. Update every quarter | ROAS target sheet and discount limit sheet by product |
Summary
-
If you stop at gross profit, the ranking doesn’t change. Its correlation with the revenue ranking is 0.99 — effectively the same list.
-
It flips at contribution margin. Correlation 0.58, an average shift of 3.1 places. The No. 2 product by revenue was last on contribution margin.
-
What flips it isn’t COGS — it’s ad spend. COGS rates differ by at most 16.5pp, while ad spend rates differ by 58.7pp.
-
Check three things before trusting the table. Fragmented product names (one product split into 19), ad spend allocation rules, and a 95% COGS match rate.
-
Cutting the 34 loss-making SKUs keeps 82.4% of revenue while lifting the margin by +8.2pp. But check each product’s role before deleting it.
Minimum settings to reproduce this report with your own data
| Item | Value | Why |
|---|---|---|
| Date range | 12 months | So a single seasonal product can’t shake up the ranking |
| Analysis dimension | Product (not Option) | With Option, each quantity option becomes its own row and the ranking fragments |
| Revenue basis | Net sales after refunds and claims, excluding VAT | Pre-adjustment revenue overstates products with many returns |
| Metrics | Revenue · gross profit · contribution margin together | You only see the flip with all three side by side |
| Contribution margin definition | Net sales − COGS − fees − shipping − ad spend | Fixed costs are excluded |
| 4-quadrant boundaries | Revenue index 35 · contribution margin rate 20% | Each brand can set its own; the median also works fine |
| Break-even ROAS | 100 ÷ (100 − COGS rate − fee rate − shipping rate) | Calculate separately by product and by channel |
Frequently asked questions
Q. What’s the difference between contribution margin and gross profit?
Gross profit is revenue minus product COGS only; contribution margin also subtracts variable costs such as fees, shipping and ad spend. In this sample there were 47.5pp between the 68.6% gross margin and the 21.1% contribution margin rate, and that gap is exactly where the ranking flipped.
Q. Should we cut every product with a low contribution margin rate?
No. Check its role first — if it’s an entry product that brings in new customers, or a cross-sell driver that lands in the cart alongside other items, you need to evaluate it including the follow-on purchases of the customers it brings in, even if its own contribution margin is low. The real phase-out candidates are low-revenue, low-margin products with no role.
Q. Can we start if our COGS data isn’t cleaned up?
It doesn’t have to be perfect. Even starting with average COGS rates by product category is enough to reveal the gap between revenue rank and profit rank. A realistic approach is to fill in actual COGS starting with the products that show the biggest gaps.
Q. Some channels show a negative contribution margin rate. Should we pull out of them?
Don’t judge by ratios alone. In small-revenue channels, the ratio easily explodes because of how ad spend is allocated (PART 05, Pitfall ②). First check the amount involved, and by what rule that ad spend was attached to the channel.
Q. What ROAS target should we set?
You can’t set just one. Break-even ROAS differs by product and by channel — in this sample it was 1.47–2.82x by product and 1.70–2.29x by channel. Calculate it yourself and set targets by product and by channel.
References: Strategy& (PwC) "Unlocking Hidden Value in Product Portfolios" · Deloitte Retail Profitability Study · McKinsey "The Power of Pricing" · McKinsey Assortment Optimization · Modern Retail, SKU rationalization at an oat-drink brand
The figures in this report are not real transaction data; they are illustrative values generated to reflect the distribution of Laplace benchmark metrics. They do not represent any specific customer, so please use them to understand trends rather than as absolute values. Figures from public research are cited with their source in each entry. Screen and setting names may differ slightly depending on the release.