Build 812 charts and 79% of your metrics still aren't on screen — the questions dashboards don't cover
We took apart the custom dashboards of six brands. The number of charts they had built ranged from 11 to 812, a 73x diff
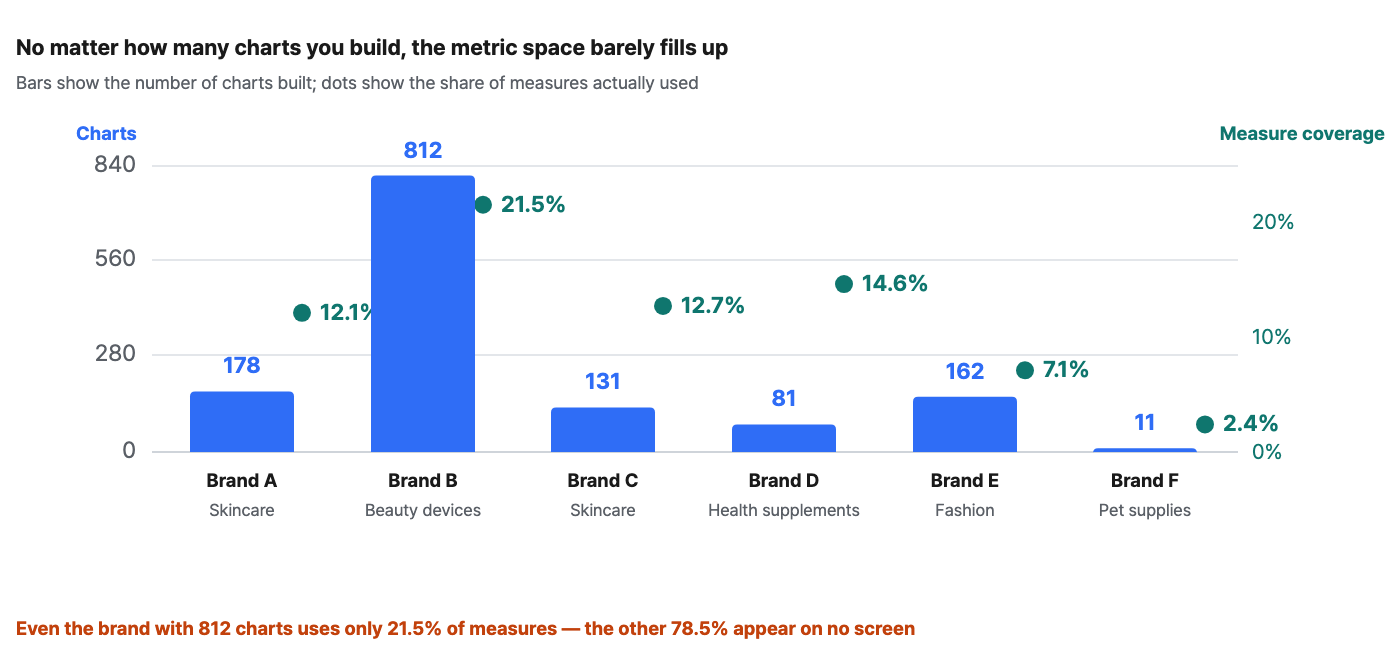
We took apart the custom dashboards of six brands. The number of charts they had built ranged from 11 to 812, a 73x difference, yet the share of measures actually used had a median of 12.4%, and the share of dimensions a median of 3.9%. No matter how many dashboards you build, pre-built screens only answer the questions you anticipated in advance.
Six commerce brands · every custom dashboard reviewed · mixed categories. For each section, we also note the Laplace screen and settings where you can see that number.
The figures in this report are not actual transaction data; they are illustrative values generated to reflect the distribution of Laplace benchmark metrics. They are not the actual figures of any specific customer, so please use them to understand trends rather than as absolute values.
PART 01 · Self-check first — the question isn't "Do we have enough dashboards?"
-
From the moment you think "I wonder what this number is" to actually seeing the answer, how long does it take on average? (Instantly / a few hours / the next day or later)
-
How many agenda items in last month's meetings ended with "We'll have to check the data on that"?
-
When a question comes up that no dashboard covers, who builds the answer? And what happens when that person is away?
-
Has your team recently put off an analysis request and ended up deciding on gut feeling?
The point isn't how many dashboards you have. What determines your team's level of data use is how quickly you can handle a question that no dashboard covers. And as the next section shows, "questions no dashboard covers" are not the exception but the majority.
| Study | Reported figure |
|---|---|
| Anaconda · Crowdflower | 45–80% of data practitioners' time goes to collecting and cleaning data |
| IBM | 85% of data leaders said decisions made on stale data led to financial losses |
So far, these are other people's numbers
Up next — counting how much dashboards actually cover. ›
PART 02 · Priority #1 — building more charts doesn't raise coverage
The figures in this report are not actual transaction data; they are illustrative values generated to reflect the distribution of Laplace benchmark metrics. They are not the actual figures of any specific customer, so please use them to understand trends rather than as absolute values.
Where to find it in Laplace — Custom Dashboard › Document List
| Charts built (median) | Share of measures used (median) | Share of dimensions used (median) | Measure coverage of the brand with the most charts |
|---|---|---|---|
| 146 | 12.4% | 3.9% | 21.5% |
| Brand | Category | Charts | Measures used | Coverage % | Dimensions used | Coverage % | Top-2 chart types % |
|---|---|---|---|---|---|---|---|
| Brand A | Skincare | 178 | 84 | 12.1 | 94 | 6.1 | 52.4 |
| Brand B | Beauty devices | 812 | 149 | 21.5 | 108 | 7.0 | 69.3 |
| Brand C | Skincare | 131 | 88 | 12.7 | 51 | 3.3 | 58.1 |
| Brand D | Health supplements | 81 | 101 | 14.6 | 71 | 4.6 | 61.7 |
| Brand E | Fashion | 162 | 49 | 7.1 | 38 | 2.5 | 46.2 |
| Brand F | Pet supplies | 11 | 17 | 2.4 | 12 | 0.8 | 72.7 |
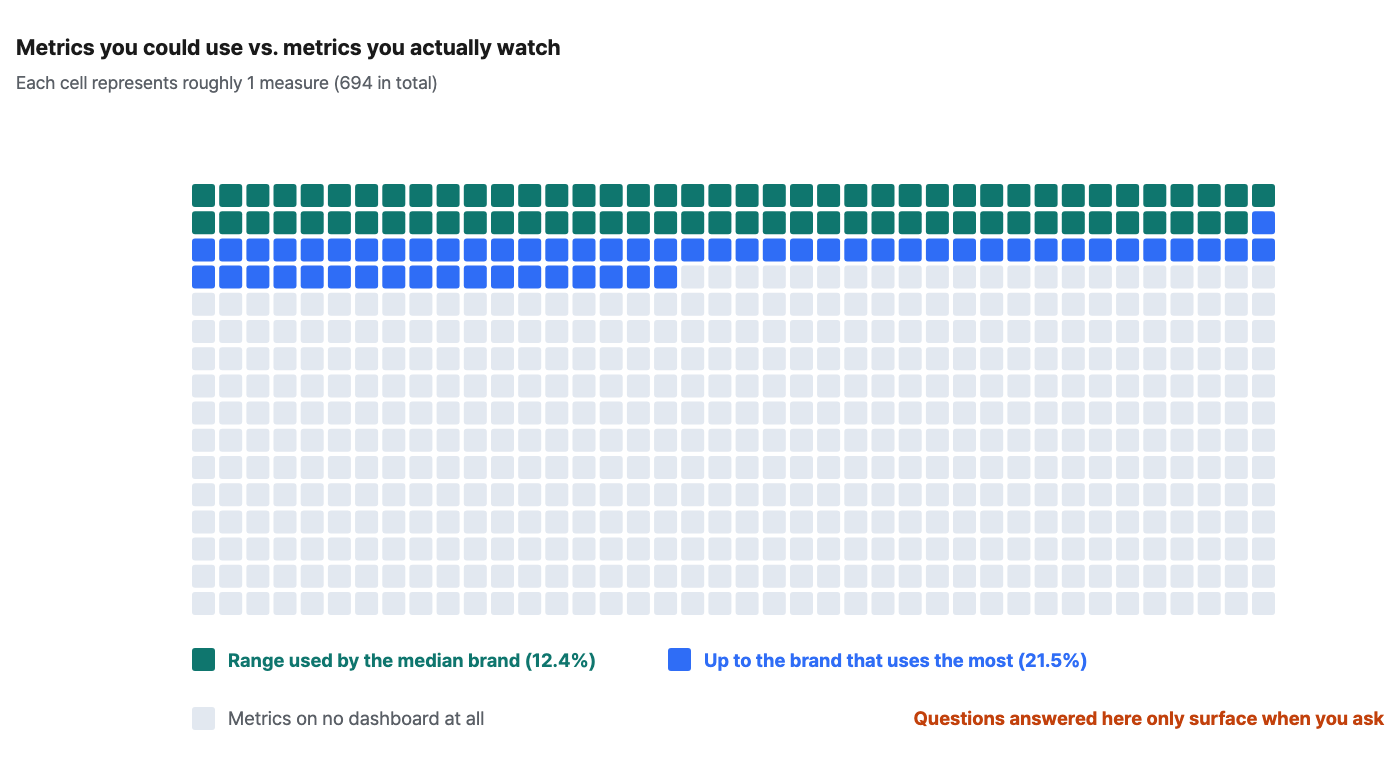
Coverage = measures (dimensions) actually used in dashboards ÷ all available measures (dimensions). The totals are 694 measures and 1540 dimensions.
How to read these numbers
Up next — a picture of how much ground is left uncovered. ›
PART 03 · Most metrics go unwatched
How to read these numbers
Even the shape of the question is constrained
Up next — so, what to ask. ›
PART 04 · 12 questions you can use right away
The analyses covered on this blog — net margin · contribution margin · confirmed sales gap · dead stock · marginal ROAS — all become one-sentence questions. These are the items that sat in the gray cells of the previous section.
| Area | Questions to copy and paste as-is |
|---|---|
| Sales · channels | Compare last month's net sales and margin rate by channel in a table. Show me how this week's sales differ from the same weekdays last week. Show the top 10 products by sales over the last 90 days side by side with their contribution margin rank. |
| Customers · repeat purchases | Show the monthly trend of first-time customers converting to a second purchase. Compare revenue per buyer over the last 90 days for products with many reviews versus products with none. How is the share of sales from top-tier customers changing? |
| Ads · promotions | Show ROAS and POAS side by side by campaign and point out the campaigns whose rank changes. Calculate the gap between same-day sales and confirmed sales for the last promotion period. Tell me if any product's sales have started to flatten relative to ad spend. |
| Inventory · operations | List SKUs with zero shipments in the last 90 days but a large inventory value. Tell me which products will sell out within 30 days at the current sales pace. Check whether any product's return rate by channel has spiked above normal. |
Three traits of a good question
Up next — what happens after you get the answer matters even more. ›
PART 05 · Pitfalls — principles for handling AI answers
Pitfall ① Check the basis first
This problem has come up again and again on this blog — whether "sales" means order-time or confirmed sales, whether VAT is included, whether refunds are reflected. When the AI gives you an answer, check what basis it was calculated on before looking at the number. If the basis differs, the answer isn't wrong — it's an answer to a different question.
Pitfall ② Slice an unfamiliar conclusion one more time
We've also repeatedly confirmed that aggregate numbers erase individual signals. When the AI answers "Overall, it looks like this," ask one more time: "Break it down by channel," "Break it down by product." It's not unusual for a single follow-up question to overturn the conclusion.
Pitfall ③ Distinguish answers missing for lack of data from answers missing despite the data
Unconnected channels, unregistered COGS, unmatched ad spend — if the ingredients are missing, the AI can't produce the answer either. If an answer looks off, before rephrasing the question, check whether the ingredients for that metric are in place. That's why every report on this blog lists the "prerequisites" first.
| Check item | How to check | If you skip it |
|---|---|---|
| Sales basis | Ask back for the metric definition used in the answer | You get an answer to a different question |
| Aggregation axis | "Break it down by channel/product" | Individual signals get buried in the aggregate |
| Data readiness | COGS and ad matching rates, channel connection status | An answer calculated from empty data |
| Period | Whether the question specified a period | The AI picks an arbitrary period |
| Make it permanent? | Promote questions you ask repeatedly to a dashboard | You ask the same question over and over |
Summary · four sentences
-
Chart count and coverage are not proportional. Even the brand that built 812 charts uses only 21.5% of measures and 7.0% of dimensions.
-
Most metrics go unwatched. Median measure coverage is 12.4% and median dimension coverage is 3.9% — "questions no dashboard covers" are not the exception but the default.
-
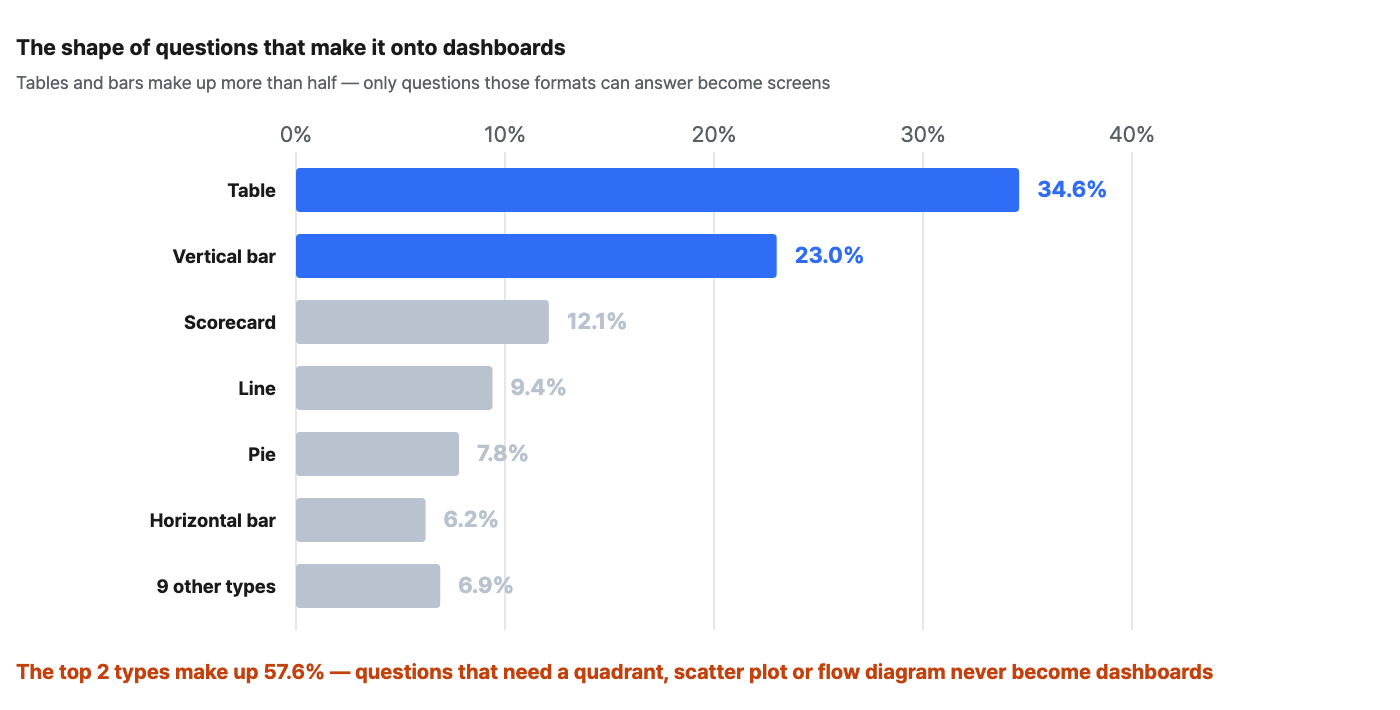
Even the shape of the question is constrained. Tables and bars make up 57.6% — analyses in formats that are a hassle to build never become screens in the first place.
-
The fix isn't building more screens but producing answers without a screen. Then you only promote to a dashboard the questions you find yourself asking repeatedly.
Reproduction setup · how to measure your brand's coverage
| Item | Value | Why |
|---|---|---|
| Numerator | Number of unique measures and dimensions actually used in dashboards | A metric used in several charts still counts as 1 |
| Denominator | Total number of measures and dimensions selectable on the analysis screens | Varies with the brand's connection status |
| Chart types | Share of charts by type | Checks whether the shape of questions is constrained |
| Also look at | Number of dashboards actually opened in the last 30 days | What you build and what you view are two different things |
| Interpretation | Low coverage itself is not the problem | It measures the structural limits of building things in advance |
FAQ · Frequently asked questions
Q. If our coverage is low, should we build more dashboards?
No. In this sample, even the brand that built 812 charts had only 21.5% coverage. This isn't a problem you solve by building more. What you need is a way to get answers without a screen, and an order of operations in which only recurring questions get promoted to screens.
Q. Why is dimension coverage especially low?
Measures are easy to swap, but the axes you slice by harden into habit. They get fixed at channel, product and period, while axes like payment method, traffic source and customer tier are never even tried. That's why simply stating "which axis to break it down by" in your question can lead to new findings.
Q. How far can we trust AI answers?
Check the basis before the number: which metric definition, which period and which axis were used in the calculation. And verify unfamiliar conclusions by slicing them one more time — the problem of aggregates erasing individual signals has been confirmed repeatedly on this blog.
Q. If the answer looks strange, should we change the question?
Look at the ingredients before the question. If COGS isn't registered, ads aren't matched or channels aren't connected, no phrasing will get you an answer. The "prerequisites" in each report are that list.
References: Anaconda · Crowdflower survey on data practitioners' time · IBM data leader survey
The figures in this report are not actual transaction data; they are illustrative values generated to reflect the distribution of Laplace benchmark metrics. They are not the actual figures of any specific customer, so please use them to understand trends rather than as absolute values. Figures from public research are cited with their sources in each item. Screen names and setting names may differ slightly depending on the release.