The Price Tag on “It’ll Sell Eventually”: How to Identify and Clear Deadstock
The most expensive mistake is believing that leaving stock alone costs nothing. When we broke down this brand’s inventor
The most expensive mistake is believing that leaving stock alone costs nothing. When we broke down this brand’s inventory, just 7 SKUs were tying up 27.0% of total inventory value, and more than half of that was stock shipped overseas that never sold and is now stranded there. Yet the commonly used rule (“no recent shipments AND 1+ year to sell through”) catches only 0.0% of it.
Sample data from a commerce brand · last 180 days of inventory history · 71 SKUs with stock on hand (22 shown in tables). Each part also notes the Laplace screen and settings where you can see that number.
The figures in this report are not real transaction data; they are sample values generated to reflect the distribution of Laplace benchmark metrics. They do not represent any specific customer’s actual results. Please use them to understand trends, not as absolute values.
PART 01 · First: which screens to open
| Menu | Screen | Which numbers in this report | Priority |
|---|---|---|---|
| Inventory Analysis | Inventory Status · Turnover | Ending stock, inventory value, turnover and estimated depletion period by SKU | Top priority |
| Data Management | Inventory History Sync | The prerequisite for this report: shipment and ending-stock history | Top priority |
| Inventory Analysis | ABC Analysis | Group C × highest inventory value = deadstock candidate list | Top priority |
| Product Analysis | By Product | Measuring changes in shipments and sales after clearance | Second priority |
| Product Analysis | By Option | Deadstock created by option expansion: preventing a repeat | Second priority |
| Custom Dashboard | Inventory map (turnover × inventory value) | Visualizing the clearance review zone | Second priority |
| Custom Alerts | Inventory age threshold alert | Automatically flags a SKU once it passes the age threshold | Third priority |
Deadstock is a problem nobody owns
PART 02 · Start with a self-check: if you answer “no” to 3 and 4, you’re in the majority
-
Do you know the total inventory value of SKUs with zero shipments in the last 90 days?
-
Can you state deadstock’s share (%) of your total inventory assets?
-
Do you have documented decision criteria for clearing deadstock (when, at what price, and how)?
-
Have you deliberately cleared deadstock in the past year (not just let it sell through on its own)?
This article contains no industry benchmarks
Next screen: you can’t make a clearance decision on a hunch that something “isn’t selling.” First, define it in numbers.
PART 03 · Top priority: get the rule wrong and it catches nothing
Brand E is a Korean pet-supplies brand. It sells non-food items with effectively no expiry date, such as harnesses, carriers, pee pads and feeders. Even when they don’t sell, they can physically sit in storage for years, and that is exactly what lets deadstock grow.
Before you read the numbers
Where to find it in Laplace: Inventory Analysis › Inventory Status · Turnover
How to set it up
-
Finish Inventory History Sync first. The estimated depletion period can only be calculated once shipment quantities and ending stock are recorded by date.
-
Set the date range to 180 days. With 90 days, products that sell on a quarterly cycle get mistaken for deadstock.
-
Always turn on inventory value as a measure. If you look only at quantities, low-cost consumables crowd the top of the list.
-
Sort by estimated depletion period, but don’t use the result as is. PART 04 explains why.
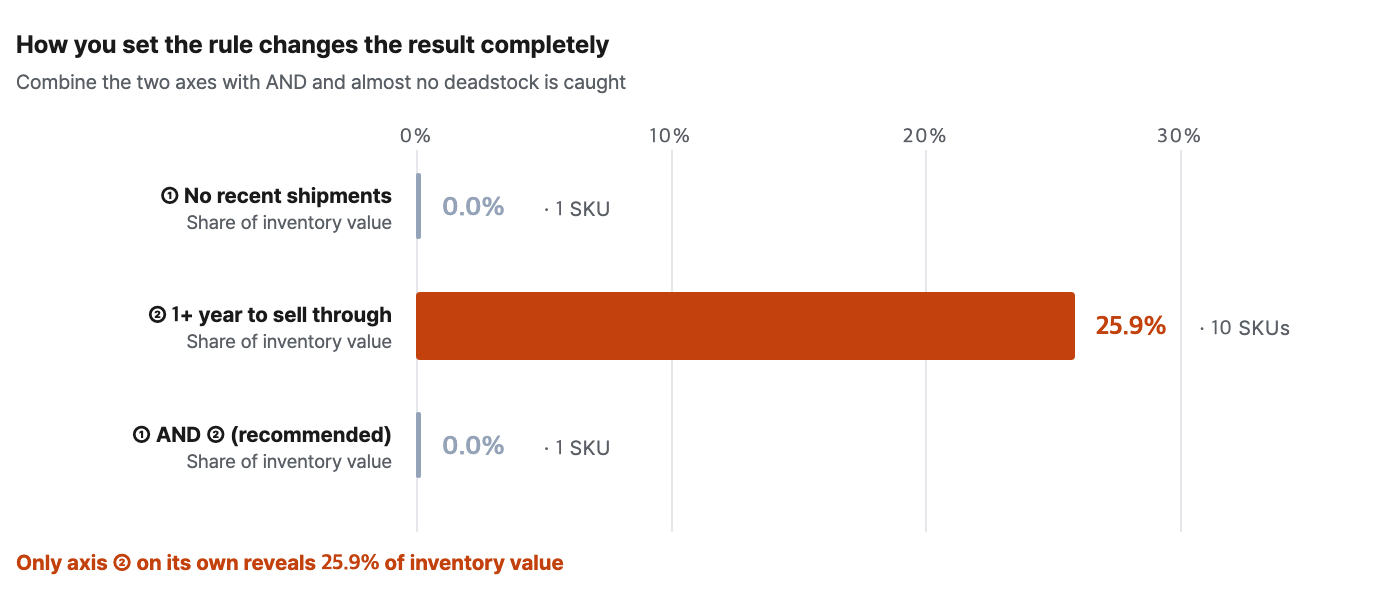
| ① No recent shipments | ② 1+ year to sell through | ① AND ② (the commonly recommended rule) | Actual deadstock |
|---|---|---|---|
| 0.0% | 25.9% | 0.0% | 27.0% (7 SKUs) |
How to read the numbers
-
The “no recent shipments” axis barely works for this brand. It catches 1 SKU, which is 0.0% of inventory value. That isn’t because there’s no deadstock; it’s because everything sells a little. The real problem is products that move a few units a month while thousands sit in stock.
-
Combine the two axes with AND and only 0.0% is left. It’s the commonly recommended rule, but applied to this brand as is, it leads to the conclusion that there is almost no deadstock.
-
Only the estimated depletion period on its own reveals the 25.9%. Choosing a rule isn’t about borrowing someone else’s formula; it’s about checking which axis actually works on your own inventory and picking that one.
Next screen: you’ve picked your axis. But if you open the list sorted by that axis as is, the meeting goes off the rails.
PART 04 · The trap: never use the top of the depletion-period list as is
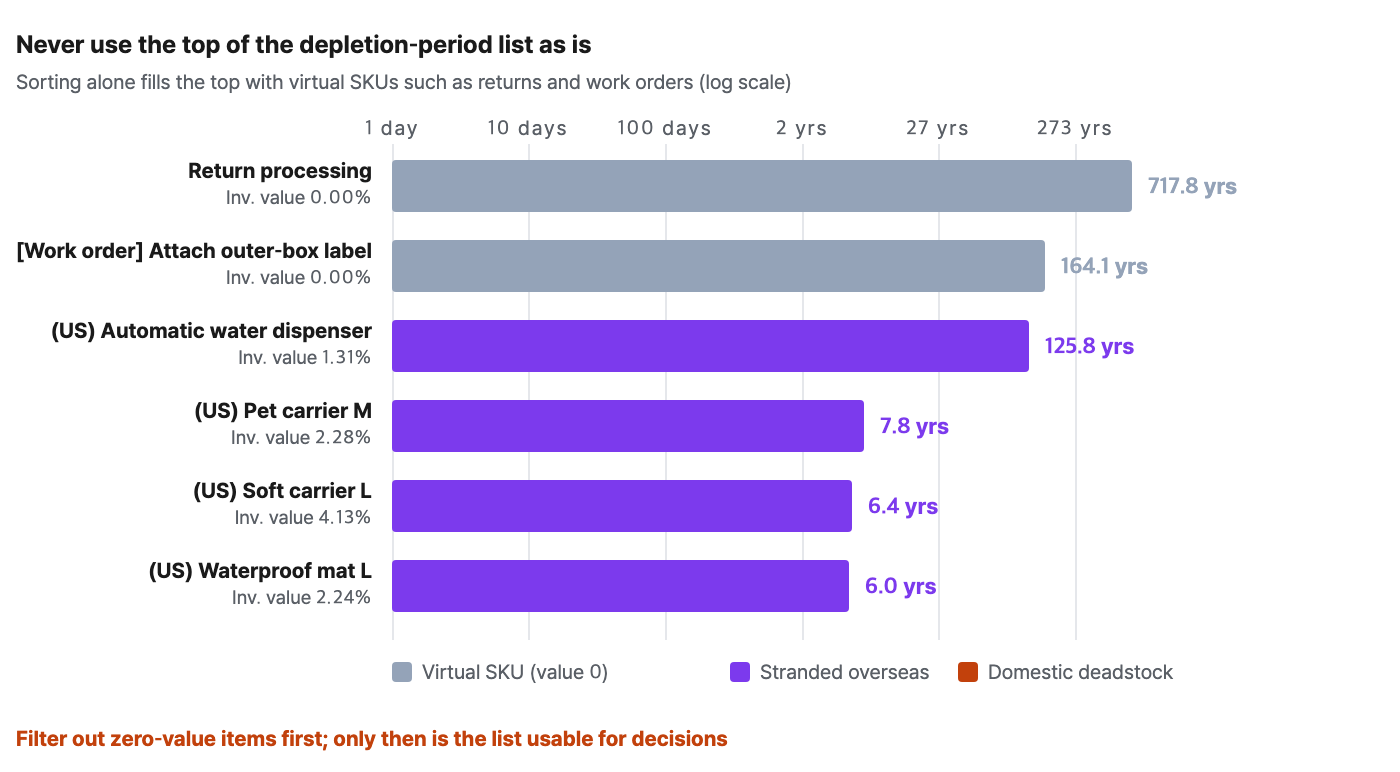
The top 2 are virtual SKUs with zero inventory value
How to make the list usable
-
Exclude items with zero inventory value first. Virtual SKUs carry no value, so this one step filters out most of them.
-
Separate the gift and packaging-materials categories. They aren’t products for sale, so they aren’t clearance targets either.
-
Tag seasonal products and exclude them from the rule. Zero shipments off-season is normal. Skip this and winter products will pollute the list every spring.
-
Re-sort the remaining list by inventory value. Where the most money is tied up matters more than the longest depletion period.
Next screen: the list is clean. Now let’s look at what the real deadstock is.
PART 05 · The real deadstock, once virtual SKUs are removed
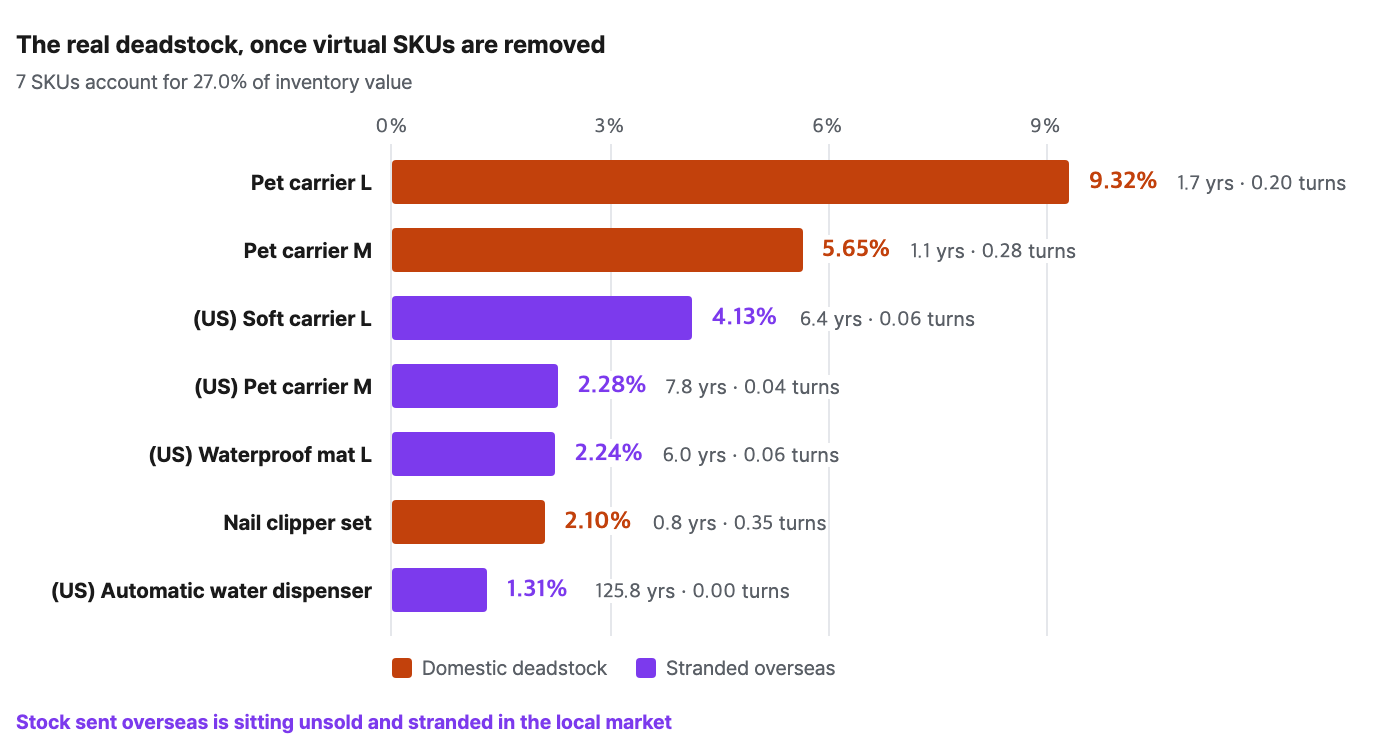
| Product | Category | Inventory value index | Est. depletion (days) | Est. depletion (years) | Turnover | Inventory age (days) |
|---|---|---|---|---|---|---|
| (US) Automatic water dispenser | Stranded overseas | 1.31 | 45,900 | 125.8 | 0.00 | 45,960 |
| (US) Pet carrier M | Stranded overseas | 2.28 | 2,841 | 7.8 | 0.04 | 2,854 |
| (US) Soft carrier L | Stranded overseas | 4.13 | 2,341 | 6.4 | 0.06 | 2,354 |
| (US) Waterproof mat L | Stranded overseas | 2.24 | 2,203 | 6.0 | 0.06 | 2,216 |
| Pet carrier L | Domestic deadstock | 9.32 | 607 | 1.7 | 0.20 | 674 |
| Pet carrier M | Domestic deadstock | 5.65 | 411 | 1.1 | 0.28 | 477 |
| Nail clipper set | Domestic deadstock | 2.10 | 310 | 0.8 | 0.35 | 387 |
Inventory value index: total inventory value = 100. Estimated depletion period = current stock ÷ recent sales velocity. Turnover = shipments in the period ÷ average inventory.
How to read the numbers
-
7 SKUs are tying up 27.0% of inventory value. Of these, 4 SKUs (10.0%) are stock shipped overseas, left unsold and stranded in the local market. Compared with domestic deadstock, it is spotted later and has fewer clearance options.
-
The single largest item is “Pet carrier L” (9.32%). 1.7 years to sell through, turnover of 0.20. It sits in exactly the zone people wave off with “well, a few still sell every month,” yet it ranks No. 1 by locked-up value.
-
Turnover differs from healthy products by an order of magnitude. Healthy products turn 0.50–13.42 times, while deadstock turns 0.00–0.35 times. Set the cutoff at 0.5 and most of them separate cleanly.
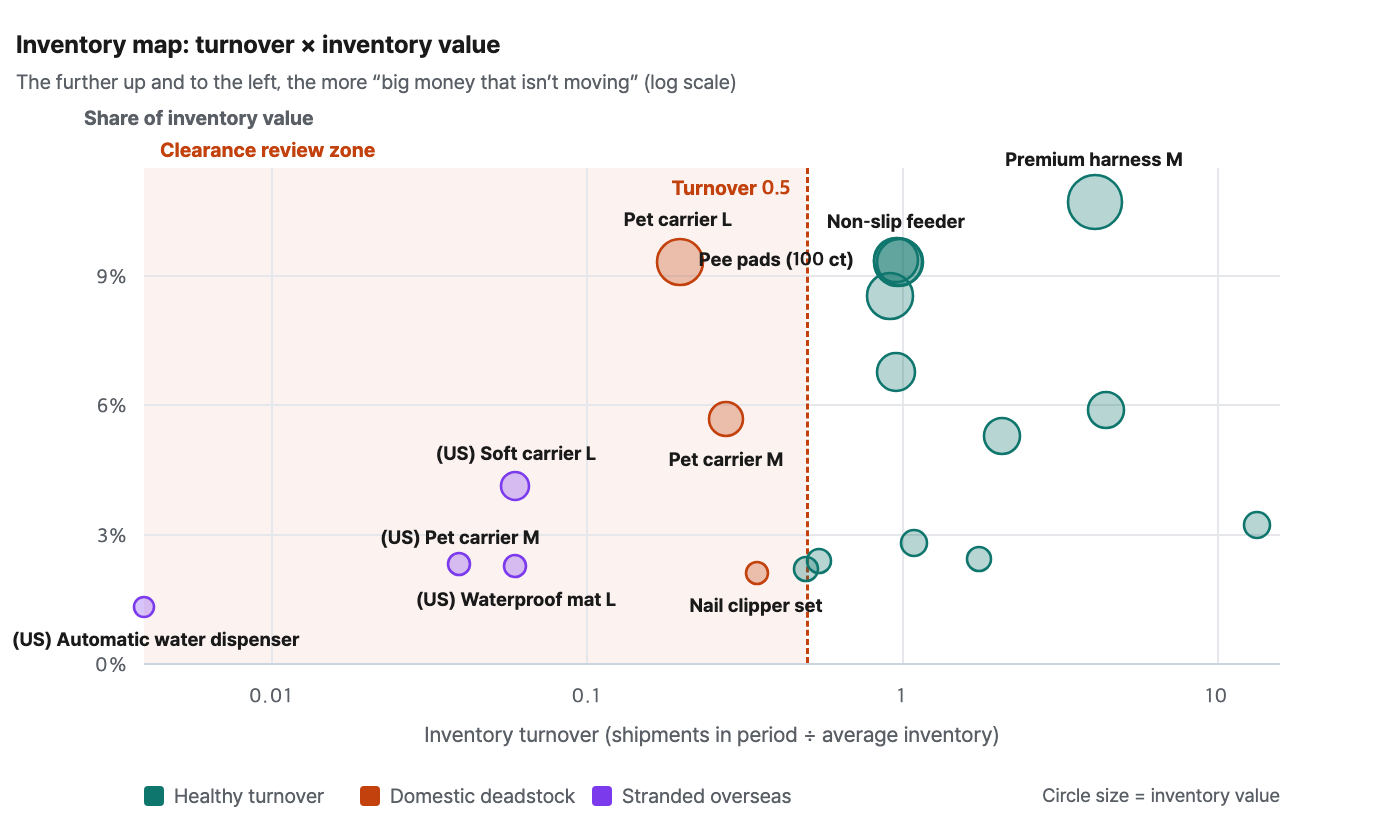
An inventory map makes clearance priorities obvious at a glance
Next screen: you have the list. But every meeting stalls at “If we discount, we lose money.”
PART 06 · Busting a myth: why “selling below cost means a loss” is wrong
Clearance discussions always stall at the same point: “COGS is KRW 10,000. If we sell at KRW 8,000, we lose KRW 2,000 per unit.”
This math is wrong because COGS is money already spent (a sunk cost). At the moment you decide on clearance, that cost isn’t coming back. What you should compare isn’t “profit or loss versus COGS” but “the cash you recover by clearing now” versus “the costs you keep paying by holding on.”
| What to calculate | |
|---|---|
| If you clear | Cash recovered = clearance price × quantity − clearance costs (shipping, promotion fees, etc.) |
| If you hold | Monthly storage cost × expected holding period + opportunity cost of capital (locked-up COGS × period) + value erosion (the achievable clearance price itself falls over time) |
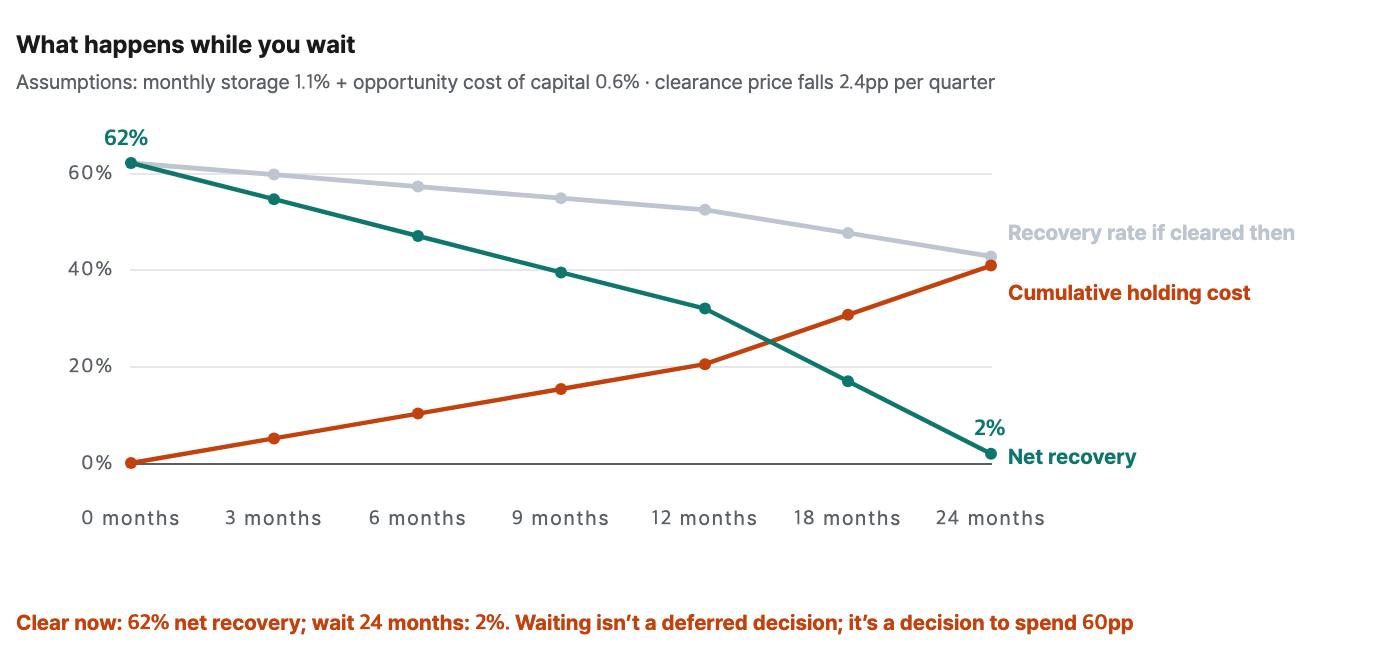
Putting it off isn’t a deferred decision. It’s a decision to spend 60pp
Once this framing takes hold, the question in the meeting changes: from “How much are we losing?” to “How much can we recover now, and how much more will it cost if we wait?” Clearing a product with KRW 10,000 COGS at KRW 8,000 isn’t “a KRW 2,000 loss”; it’s “KRW 8,000 recovered.”
Next screen: you’ve decided to clear. Now the question is in what order.
PART 07 · The clearance ladder: in order of least margin lost
Clearance doesn’t automatically mean a fire sale. The options form a ladder ordered by recovery rate, and the principle is to start at the top rung but set a deadline for each one. Lingering on an upper rung with no deadline is just deferring the decision under another name.
| Rung | Option | Recovery | Best for | Example deadline |
|---|---|---|---|---|
| 1 | Revisit visibility and selling approach: search keywords, product detail page, channel expansion | Full price | Good products that got buried (SKUs with strong reviews but no traffic) | 4–6 weeks |
| 2 | Bundles and sets: pair with a bestselling main product to lift revenue per buyer | Full price to slight discount | Products whose use case connects to your core products | 1–2 promotion cycles |
| 3 | Convert to gifts: give away with purchases above a set amount | Part of COGS (indirect recovery) | Low-cost, high-quantity products | Until depleted, but measure the effect |
| 4 | Special promotions and outlet discounts: explicit discount sales | Clearance price | When the rungs above don’t move stock fast enough | Step up the discount every 2–4 weeks |
| 5 | Bulk B2B liquidation: stock liquidators, closed (members-only) malls, cross-border sales | A fraction of COGS | When volumes are too large to realistically sell through at retail | Compare quotes immediately |
| 6 | Donate or dispose | 0 (stops storage costs + tax treatment) | Last resort, when clearance costs exceed what you’d recover | — |
Rungs 2 and 3 (bundles and gifts) aren’t free
On rung 4 (discounts), the way to protect price trust is “isolation”
Preventing a repeat: deadstock is born at the purchase order, not in the warehouse
| Where it’s born | What happens | Response |
|---|---|---|
| ① Initial orders for new products | Initial quantities set on the optimistic assumption that “we’ll sell at least this much” are the biggest source | Keep initial orders conservative and shorten reorder lead times. Feed sales velocity from the first 4–8 weeks after launch straight into reorder decisions |
| ② Option expansion | Every new color or size splits off another SKU, but demand isn’t spread evenly across options. The 2–3 popular options drive most sales while the rest quietly turn into deadstock | Check each option’s share of sales before ordering. The key is breaking the habit of ordering the same quantity for every option |
| ③ Initial stock for overseas expansion | More than half of this brand’s deadstock (10.0pp of 27.0pp) came from here. Stock sent without knowing local demand ends up stranded, unable even to come back | Be even more conservative than at home with initial overseas orders. Don’t restock until local sales velocity has been confirmed |
Action plan · a quarterly deadstock review that takes just 90 minutes
| Step | What to do | Done when |
|---|---|---|
| 1 (20 min) | In Inventory Analysis › Inventory Status, sort by estimated depletion period. Exclude zero-value items, gifts and seasonal products | You have a usable list of deadstock candidates |
| 2 (20 min) | Re-sort the candidates by inventory value and calculate the holding cost of each SKU | A per-SKU table comparing “recover now vs. recover in 6 months” |
| 3 (30 min) | Assign each SKU a ladder rung and a deadline. No rung assignment without a deadline | A SKU × rung × deadline table (with owner names) |
| 4 (20 min) | Review the results of the rungs assigned last quarter: did it sell through, did it miss the deadline, should it move down a rung? | Rung-move decisions · measured impact of gift conversions on revenue per buyer |
Summary
-
Don’t borrow your rule from someone else’s formula. “Zero shipments AND 1 year to sell through” caught only 0.0% of inventory value; the estimated depletion period on its own revealed 25.9%.
-
Don’t use the list as is. The top 2 by depletion period were virtual SKUs with zero inventory value; a return-processing code took No. 1 with “718 years to sell through.”
-
The real deadstock was 7 SKUs, or 27.0% of inventory value. Of that, 10.0pp was stock shipped overseas and stranded there.
-
Putting it off isn’t a deferred decision. Clear now and you net 62%; wait 24 months and you net 2%. That’s a decision to spend 60pp.
-
Deadstock is born at the purchase order, not in the warehouse. Initial orders for new products, option expansion and initial stock for overseas expansion: unless you plug these three sources, clearance will repeat every quarter.
Minimum setup to reproduce this report with your own data
| Item | Value | Why |
|---|---|---|
| Prerequisite | Inventory History Sync (daily shipments and ending stock) | Without it, the estimated depletion period can’t be calculated |
| Date range | 180 days | 90 days mistakes products that sell quarterly for deadstock |
| Measures | Inventory value · estimated depletion period · turnover · inventory age | Quantities alone put low-cost consumables at the top |
| Rule axis | First check which axis works on your inventory | For many brands, the zero-shipment axis doesn’t work |
| Exclusions | Zero inventory value · gifts/packaging materials · seasonal products | Otherwise virtual SKUs pollute the top of the list |
| Sorting | Pull candidates by depletion period → re-sort by inventory value | Where the most money is tied up comes first |
| Turnover cutoff | 0.5 (adjust per brand) | Healthy and deadstock groups generally split here |
Frequently asked questions
Q. What are the criteria for identifying deadstock?
The common recommendation is “zero shipments in the last 90 days AND an estimated 1+ year to sell through.” However, in this sample that rule barely worked (0.0%), because the real problem was SKUs that sell a little while carrying overwhelmingly large stock. Run each axis separately and pick the one that works on your inventory. Whichever axis you use, seasonal products should be tagged and separated out.
Q. Isn’t discounting below cost a loss?
COGS is money already spent, and it doesn’t come back at the time of clearance. What you should compare is “the cash recovered by clearing now” versus “the storage, opportunity costs and value erosion of continuing to hold.” Selling a product with KRW 10,000 COGS for KRW 8,000 isn’t a KRW 2,000 loss; it’s KRW 8,000 recovered.
Q. Can’t we just use up deadstock as free gifts?
It’s a valid option, but it isn’t free. Gifts carry logistics costs, and an off-brand product can even hurt the experience of the main product. Unless you measure whether the conversion actually lifted revenue per buyer or conversion rate, you may simply have moved the disposal from your warehouse to your customer’s home.
Q. How should overseas inventory be handled?
It’s the hardest category. In this sample, too, more than half of the deadstock was stranded overseas. Return shipping often costs more than you would recover, so local clearance (local outlets, B2B, cross-border sales) comes first; if that fails, the next best option is donation or disposal to stop paying storage costs. The root fix is setting initial overseas quantities even more conservatively than at home.
Q. How do we prevent deadstock in the first place?
Deadstock is mostly born in three places: initial orders for new products, option expansion and initial stock for overseas expansion. The keys to prevention are keeping initial orders conservative, feeding sales velocity from the first 4–8 weeks after launch straight into reorder decisions, and checking each option’s share of sales before ordering.
The figures in this report are not real transaction data; they are sample values generated to reflect the distribution of Laplace benchmark metrics. They do not represent any specific customer’s actual results. Please use them to understand trends, not as absolute values. Figures from public research cite their sources in each section. Screen and setting names may differ slightly depending on the release.