When “Spend More on What’s Working” Is the Most Expensive Decision — Growth Headroom Through Marginal ROAS
Budget increases should be judged on marginal ROAS (the revenue generated by the next won you spend), not average ROAS.

Budget increases should be judged on marginal ROAS (the revenue generated by the next won you spend), not average ROAS. When we put the two side by side for this brand, 10 of 12 products had a marginal ROAS below their average, and 4 of the top 5 products by revenue dropped into the bottom tier when ranked by marginal efficiency. The products generating 43.2% of revenue were sitting in the “do not scale” box.
One commerce brand · 13 months · approx. 300,000 orders / approx. 240,000 purchasers · 32 products advertised in every one of the 13 months (12 shown in the tables). Each part also notes the Laplace screen and settings where you can see that number.
The figures in this report are not actual transaction data; they are illustrative values generated to reflect the distribution of Laplace benchmark metrics. They are not the actual figures of any specific customer, so please use them to understand trends rather than as absolute values.
PART 01 · First — which screen to open
| Menu | Screen | Which number in this report | Priority |
|---|---|---|---|
| Custom Dashboard | Growth capacity | Headroom signals by product and channel on one screen | Priority 1 |
| Ad Analytics | By ad channel · By campaign | Monthly ad spend and revenue trends by product → marginal ROAS calculation | Priority 1 |
| P & L Analysis | Margin rate / Contribution margin rate | The horizontal axis of the quadrant chart — margin | Priority 1 |
| Product Analytics | By product | The baseline to set beside the revenue ranking | Priority 2 |
| User Analytics | First purchase / Repurchase | Product-strength signal — products with a strong repurchase rate that simply lack exposure | Priority 2 |
| Inventory Analytics | Inventory status · Turnover | Check inventory headroom before scaling (prerequisite) | Priority 2 |
| Custom Alerts | Sudden metric change alerts | Automatically detects shifts in marginal CPA 2–4 weeks after a budget increase | Priority 3 |
Budgets are being set by the inertia of “how much did we spend last month?”
PART 02 · Start with a self-check — if you get stuck on any one of these, the cause is the same
-
Do you know which products last quarter’s budget increase went to, and have you ever calculated the marginal CPA of that increase (incremental ad spend ÷ incremental conversions)?
-
Can you say, product by product, whether the bottleneck is demand or exposure?
-
Do you know how many products have good conversion and repurchase rates but receive almost no ad budget?
-
Do you have a step for checking a product’s inventory headroom before deciding to increase its budget?
Five signals for judging growth headroom
Growth headroom isn’t a single metric; it’s a combination of signals. There is one core question — “Is this product’s bottleneck demand, or exposure?” If the bottleneck is exposure, there is headroom; if it’s demand, the product is saturated.
| Signal | Headroom remains | Close to saturation |
|---|---|---|
| ① Conversion rate | Conversion rate holds as exposure and traffic grow | Conversion rate falls as traffic grows |
| ② Marginal ROAS | ROAS stays stable even in the higher-spend range | Steps down with every increase |
| ③ Reach · frequency | Low reach against the target audience, low frequency | Rising duplicate frequency, growing reliance on retargeting |
| ④ Demand share | Low share of exposure relative to category search volume | Search share already high, large share of branded search |
| ⑤ Product strength | Strong repurchase rate and reviews, but few new visitors | The repurchase curve is bending down as well |
② is the signal this report actually measured. ①, ③ and ④ require ad platform consoles and search-volume tools, but ② can be calculated using only the ad spend and revenue data you already have. Start with the signal that is cheapest to check.
Next screen — You know the signals. Now let’s actually calculate marginal ROAS. On to PART 03. ›
PART 03 · Priority 1 — Why you shouldn’t decide budget increases on average ROAS
The figures in this report are not actual transaction data; they are illustrative values generated to reflect the distribution of Laplace benchmark metrics. They are not the actual figures of any specific customer, so please use them to understand trends rather than as absolute values.
Brand F is a Korean womenswear brand. It sells shirts, denim, outerwear and bags, and allocates its ad budget product by product. We broke 13 months of product-level ad spend and revenue down by month and compared the months with low ad spend against the months with high ad spend.
How to calculate marginal ROAS — it takes a single division
Where to find it in Laplace — Custom Dashboard › Analysis type › Growth capacity
How to set it up
-
Pull ad spend and revenue together by product at a monthly granularity. If you roll them up by quarter or year, you can’t compare spend ranges.
-
Set the period to 12 months or more. Because the months are split in half, you need at least 8 months of data.
-
Exclude months and products with negligible ad spend. When the denominator approaches zero, ROAS explodes — see PART 05, Pitfall ①.
-
Place the results side by side with the revenue ranking. This report’s conclusions come from the gap between the two rankings.
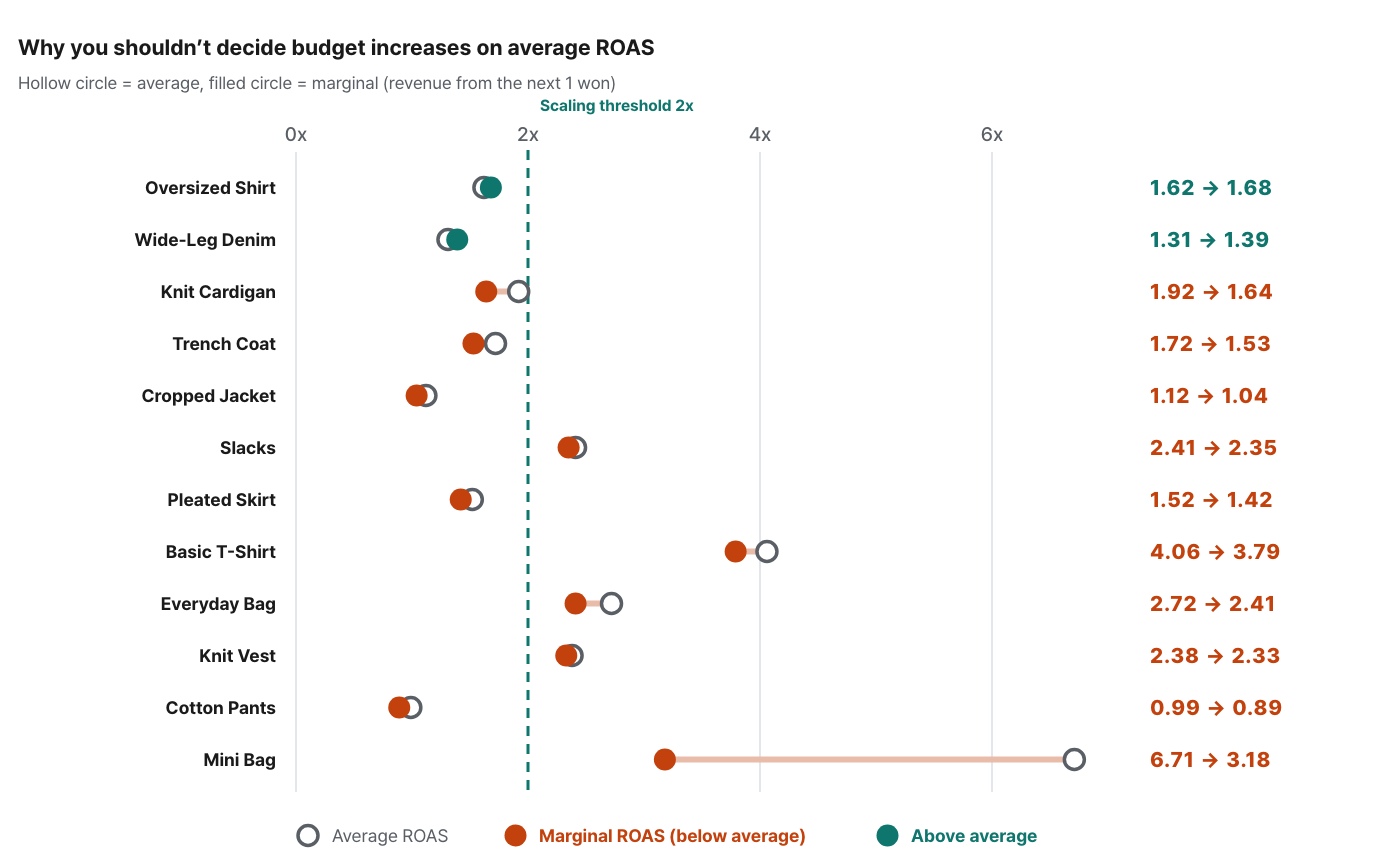
| Products with marginal ROAS < average ROAS | Correlation of revenue rank × marginal ROAS rank (32 products) | Top 5 revenue products in the bottom tier on marginal efficiency | Revenue from the “do not scale” box |
|---|---|---|---|
| 10/12 | 0.44 | 4/5 | 43.2% |
| Revenue rank | Product | Revenue share % | Avg. ROAS | Marginal ROAS | Marginal ÷ avg. | Contribution margin rate | Marginal rank | Change | Quadrant |
|---|---|---|---|---|---|---|---|---|---|
| 1 | Oversized Shirt | 20.4 | 1.62 | 1.68 | 1.04 | 13.9 | 6 | ▼5 | Harvest mode |
| 2 | Wide-Leg Denim | 17.6 | 1.31 | 1.39 | 1.06 | -2.4 | 10 | ▼8 | Review for exit |
| 3 | Knit Cardigan | 13.6 | 1.92 | 1.64 | 0.85 | 20.1 | 7 | ▼4 | Harvest mode |
| 4 | Trench Coat | 9.2 | 1.72 | 1.53 | 0.89 | 23.8 | 8 | ▼4 | Harvest mode |
| 5 | Cropped Jacket | 6.3 | 1.12 | 1.04 | 0.93 | 0.8 | 11 | ▼6 | Review for exit |
| 6 | Slacks | 5.1 | 2.41 | 2.35 | 0.98 | 29.4 | 4 | ▲2 | Top priority to scale |
| 7 | Pleated Skirt | 3.3 | 1.52 | 1.42 | 0.93 | -1.5 | 9 | ▼2 | Review for exit |
| 8 | Basic T-Shirt | 3.0 | 4.06 | 3.79 | 0.93 | 48.6 | 1 | ▲7 | Top priority to scale |
| 9 | Everyday Bag | 2.3 | 2.72 | 2.41 | 0.89 | 35.1 | 3 | ▲6 | Top priority to scale |
| 10 | Knit Vest | 2.2 | 2.38 | 2.33 | 0.98 | 8.4 | 5 | ▲5 | Fix margin first |
| 11 | Cotton Pants | 1.9 | 0.99 | 0.89 | 0.90 | -17.9 | 12 | ▼1 | Review for exit |
| 12 | Mini Bag | 1.1 | 6.71 | 3.18 | 0.47 | 59.7 | 2 | ▲10 | Top priority to scale |
How to read the numbers
Next screen — We know the marginal value is below the average. Next, let’s see at what level of spend it starts to fall. On to PART 04. ›
PART 04 · Ad spend response curves — see for yourself where efficiency starts to drop
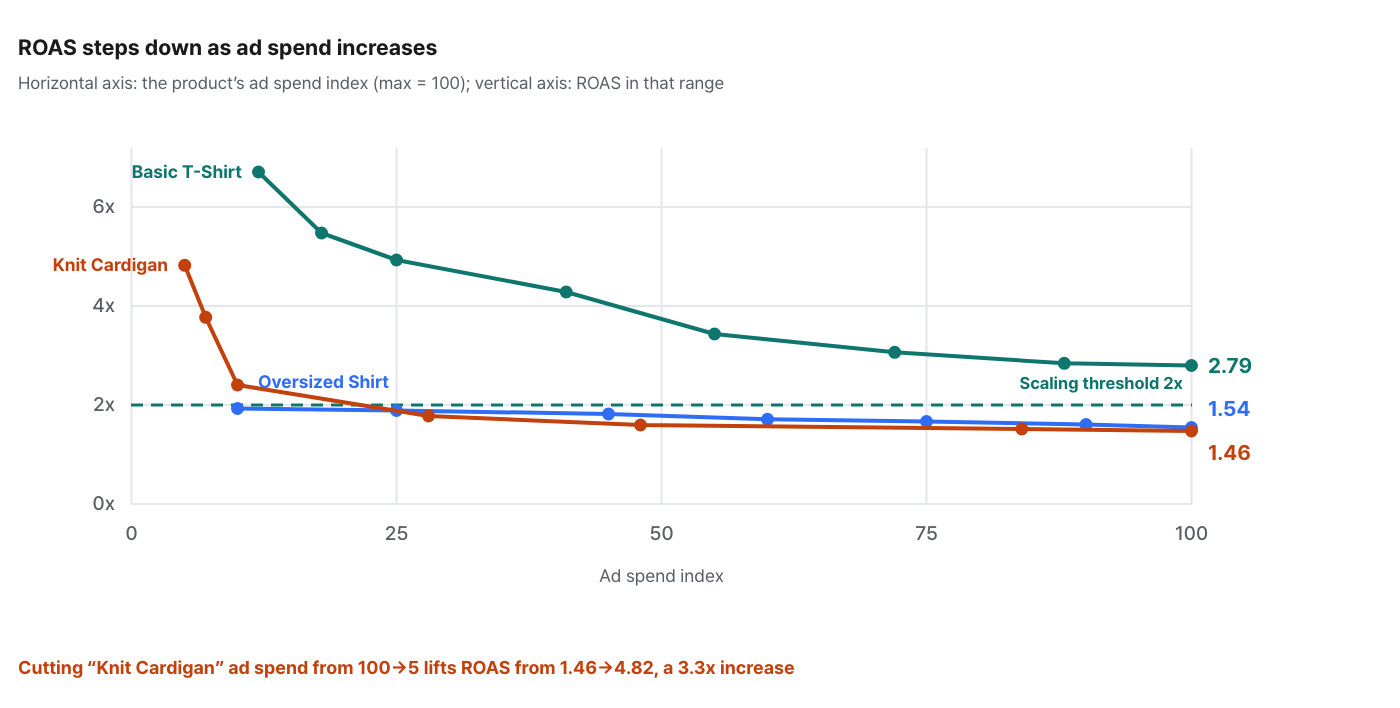
How to read the numbers
Next screen — Headroom is settled. But even with plenty of headroom, thin margins mean the more you sell, the less you keep. On to PART 05. ›
PART 05 · Scaling priority matrix — margin × marginal efficiency
Where to find it in Laplace — P & L Analysis › Margin rate / Contribution margin rate + Custom Dashboard › Growth capacity
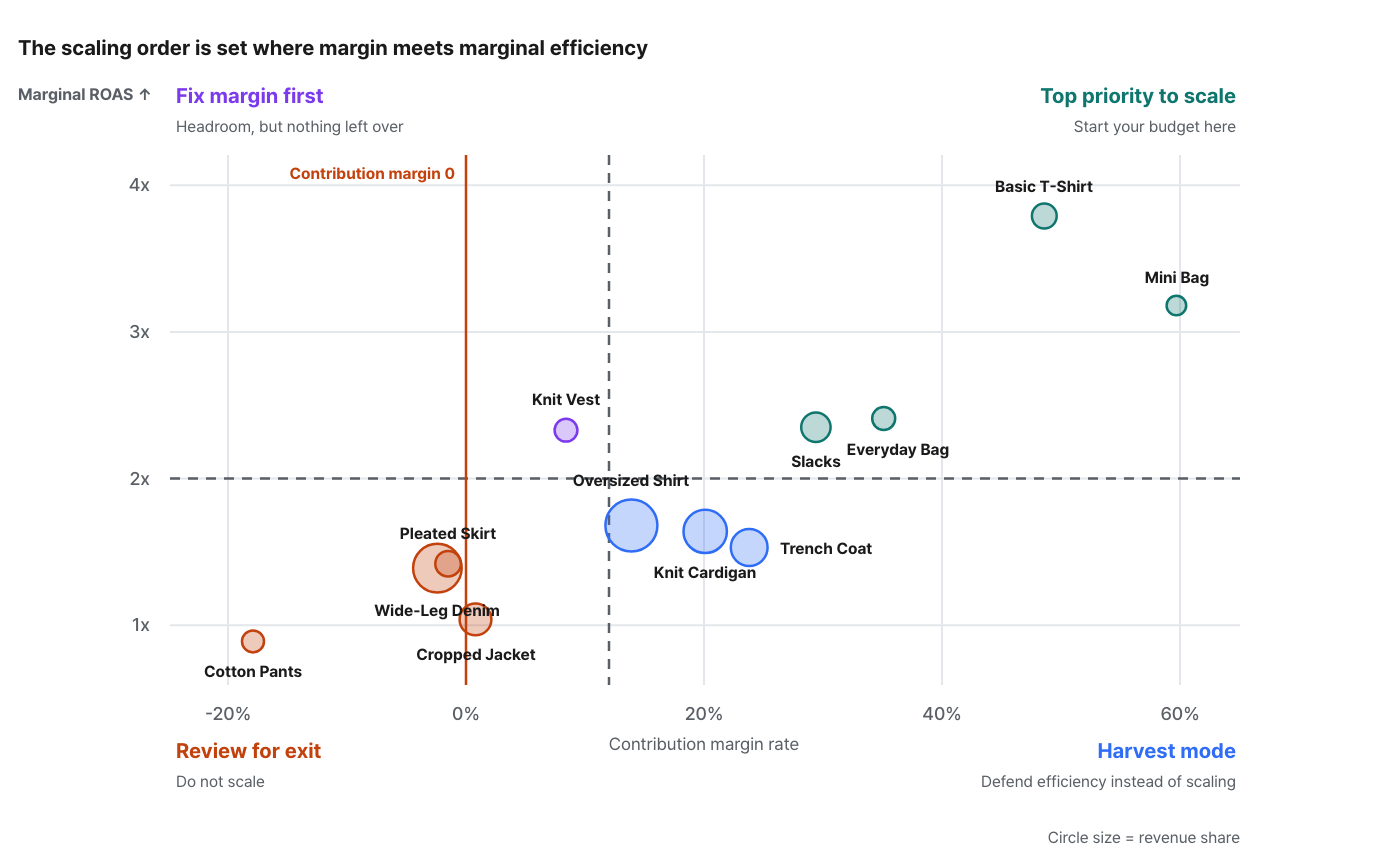
| Quadrant | In this sample | What to do |
|---|---|---|
| Top priority to scale High margin · large headroom | 4 products · 11.5% of revenue | Start your budget here. Their small share of revenue likely means they have been passed over for budget until now |
| Harvest mode High margin · saturated | 3 products · 43.2% of revenue | Defend efficiency instead of scaling. Protecting the budget in this box contributes as much to profit as winning new budget |
| Fix margin first Low margin · large headroom | 1 product · 2.2% of revenue | Raise margins through pricing, cost or bundling, then scale. Get the order wrong and the losses grow as you grow |
| Review for exit Low margin · saturated | 4 products · 29.1% of revenue | Pause ads and observe organic sales for 4 weeks → move into the dead-stock process |
The power of this matrix lies not in “where to scale” but in “where not to scale”
Hands-on walkthrough — deciding where to move budget
| Product | Rationale | Decision |
|---|---|---|
| Basic T-Shirt | Contribution margin rate 48.6% · marginal ROAS 3.79 · revenue share 3.0% | Top priority to scale — move budget in |
| Knit Cardigan | Contribution margin rate 20.1% · marginal ROAS 1.64 · cutting ad spend raises ROAS 3.3x | Harvest mode — pull the incremental budget and move it to the product above |
| Knit Vest | Contribution margin rate 8.4% · marginal ROAS 2.33 (headroom exists) | Fix margin first — rework pricing and bundles, then reassess next quarter |
| Cotton Pants | Contribution margin rate −17.9% · marginal ROAS 0.89 | Review for exit — pause ads and observe organic sales for 4 weeks |
Re-verify moved budget 2–4 weeks later
Next screen — The matrix rests on the assumption that the numbers are accurate. Three pitfalls can cloud your judgment. On to PART 06. ›
PART 06 · Pitfalls — three things that cloud judgment
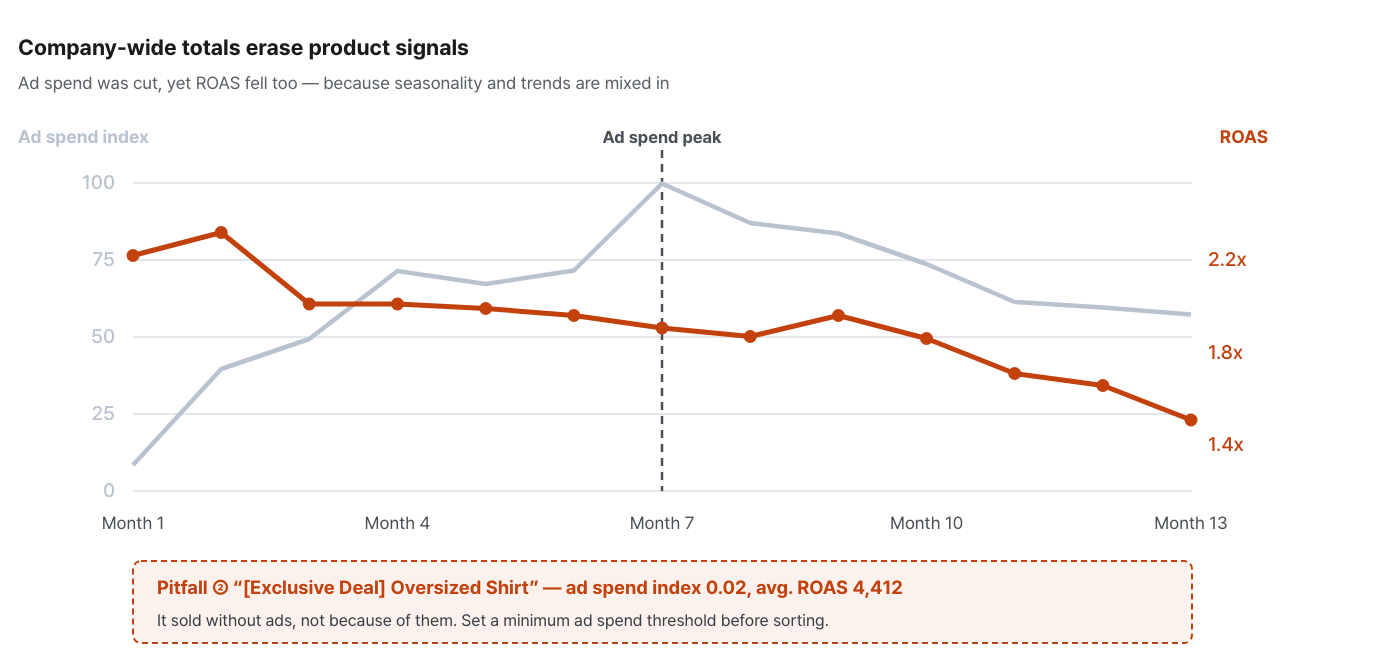
Pitfall ① When ad spend is negligible, ROAS explodes
“[Exclusive Deal] Oversized Shirt” has an ad spend index of 0.02 but an average ROAS of 4,412. Sort by ROAS and it jumps to #1 on the list. But this is a product that sold without ads, not one that ads sold.
The fix is simple — set a minimum ad spend threshold before you sort. (For example, include only products that account for 0.3% or more of company-wide ad spend.) Without a threshold, the top of the list fills up with “products that barely advertised,” and that is the list you take into your budget meeting.
Pitfall ② Company-wide totals erase product signals
In the chart above, ad spend was cut from 100 → 57, yet ROAS also fell from 1.90 → 1.51. Looking only at company-wide totals leads to the opposite conclusion: “cutting ads lowers efficiency.”
At the product level, there clearly are products whose ROAS rises when you cut spend (“Knit Cardigan” in PART 04). In aggregate, seasonality, new launches and competitive conditions all get mixed together and bury the individual signals. Always calculate marginal ROAS at the product (or channel) level.
Pitfall ③ Seasonality, promotions and inventory
| Illusion | What happens | How to check |
|---|---|---|
| Seasonal illusion | If you read the demand growth that comes with peak season as “headroom,” the entire increase turns inefficient the moment the season ends | Compare with the same period last year and with category demand. The chart in Pitfall ② above is exactly this problem |
| Promotion illusion | Higher conversion during a discount period is a price effect, not headroom | Judge by normal-period conversion rates. Offsetting a 5% discount through volume requires roughly a 19% increase in units sold (McKinsey) |
| Inventory constraint | Even with confirmed headroom, if inventory can’t keep up, scaling turns into a stockout incident | Ad-driven demand spikes break the assumptions behind safety-stock calculations. Make budget-increase and purchase-order decisions in the same meeting |
Action plan · quarterly routine
| Step | What to do | Done when |
|---|---|---|
| 1 | Pull ad spend and revenue by product × month and calculate marginal ROAS. Exclude products with negligible ad spend | You have a table of average vs. marginal ROAS by product |
| 2 | Cross it with contribution margin rate to plot the four quadrants | You have lists for Top priority to scale · Harvest mode · Fix margin first · Review for exit |
| 3 | Pull budget from “Harvest mode” and “Review for exit” and move it to “Top priority to scale.” Check inventory headroom before moving it | You have a budget reallocation table (amount · source product · destination product) |
| 4 | After 2–4 weeks, recalculate the marginal ROAS of the moved budget to verify the result | You have a before/after marginal ROAS comparison · an adjustment plan for next quarter |
Summary · five sentences
-
Judge budget increases on the margin, not the average. In this sample, 10 of 12 products had a marginal ROAS below their average.
-
The #1 by average and the #1 by marginal differ. “Mini Bag” averages 6.71, but its marginal ROAS is 3.18 — it performed well because so little was spent on it.
-
The revenue ranking won’t tell you. The correlation between revenue rank and marginal efficiency rank was 0.44, and 4 of the top 5 products by revenue were in the bottom tier on marginal efficiency.
-
43.2% of revenue sits in the “do not scale” box. Meanwhile, “Top priority to scale” is only 11.5% of revenue — those products were simply too small to stand out.
-
Company-wide totals lead to the opposite conclusion. Ad spend was cut from 100→57, yet ROAS also fell from 1.90→1.51 — always calculate at the product level.
Reproduction settings · the minimum setup to regenerate this report as is
| Item | Value | Why |
|---|---|---|
| Aggregation unit | Product × month | Marginal values only emerge when you split spend into ranges; quarterly or annual units won’t work |
| Period | 12 months or more (minimum 8 months) | Comparing two halves requires enough samples |
| Marginal ROAS | (avg. revenue, high range − avg. revenue, low range) ÷ (avg. ad spend, high range − avg. ad spend, low range) | Keeps only “the revenue generated by the next won” |
| Exclusions | Products and months with negligible ad spend | ROAS explodes when the denominator nears zero |
| Cross axis | Contribution margin rate | Looking at headroom alone leads to “growth that leaves nothing behind” |
| Quadrant boundaries | Contribution margin rate 12.0% · marginal ROAS 2.0x | Adjust for each brand; the median also works well |
| Aggregation level | Product or channel (no company-wide totals) | Totals bury individual signals under seasonality and trends |
| Post-hoc verification | Recalculate marginal ROAS 2–4 weeks after scaling | Verification, not prediction, is what completes the process |
FAQ · Frequently asked questions
Q. How do you measure growth headroom?
It isn’t a single metric but a combination of five signals — whether conversion rate holds as traffic grows, marginal ROAS by spend range, target reach and frequency, exposure share relative to category demand, and product-strength indicators such as repurchases and reviews. Of these, marginal ROAS can be calculated using only data you already have — it is the cheapest signal to check.
Q. What’s wrong with spending more on products that sell well?
Possibly nothing — if that product isn’t saturated yet. The problem is scaling out of inertia, without checking. Extra spend on a saturated product gets absorbed by rising CPA, and on top of that you lose the opportunity of funding products that still have headroom — a double loss.
Q. What should we do with products that have large headroom but low margins?
Fixing the margin structure comes before scaling. Raise the contribution margin rate first — through price adjustments, cost negotiations, steering customers to lower-fee channels, or bundles that lift revenue per buyer — and only then scale, so that growth actually leaves profit behind. As analysis showing that a 1% price improvement lifts operating profit by about 8% (McKinsey) suggests, getting the order wrong means the losses grow as you grow.
Q. How do you judge headroom for new products that have no data yet?
New products aren’t candidates for headroom assessment; they’re candidates for exploration. Put them through a stage where a small budget tests early conversion and repurchase signals, then add them to the matrix once 4–8 weeks of post-launch data has accumulated.
Q. Does the same analysis work at the channel level?
Yes. Put each channel’s net margin rate on the margin axis and the marginal ROAS within the channel on the headroom axis, and you have a matrix for reallocating channel budgets. We recommend running both levels — product and channel — together every quarter.
Reference: McKinsey, “The Power of Pricing”
The figures in this report are not actual transaction data; they are illustrative values generated to reflect the distribution of Laplace benchmark metrics. They are not the actual figures of any specific customer, so please use them to understand trends rather than as absolute values. Figures from published research are cited with their sources in each item. Screen names and setting names may differ slightly depending on the release.