We Run 16 Channels, but 95% of Revenue Comes from Three — The Cost of Multichannel Aggregation
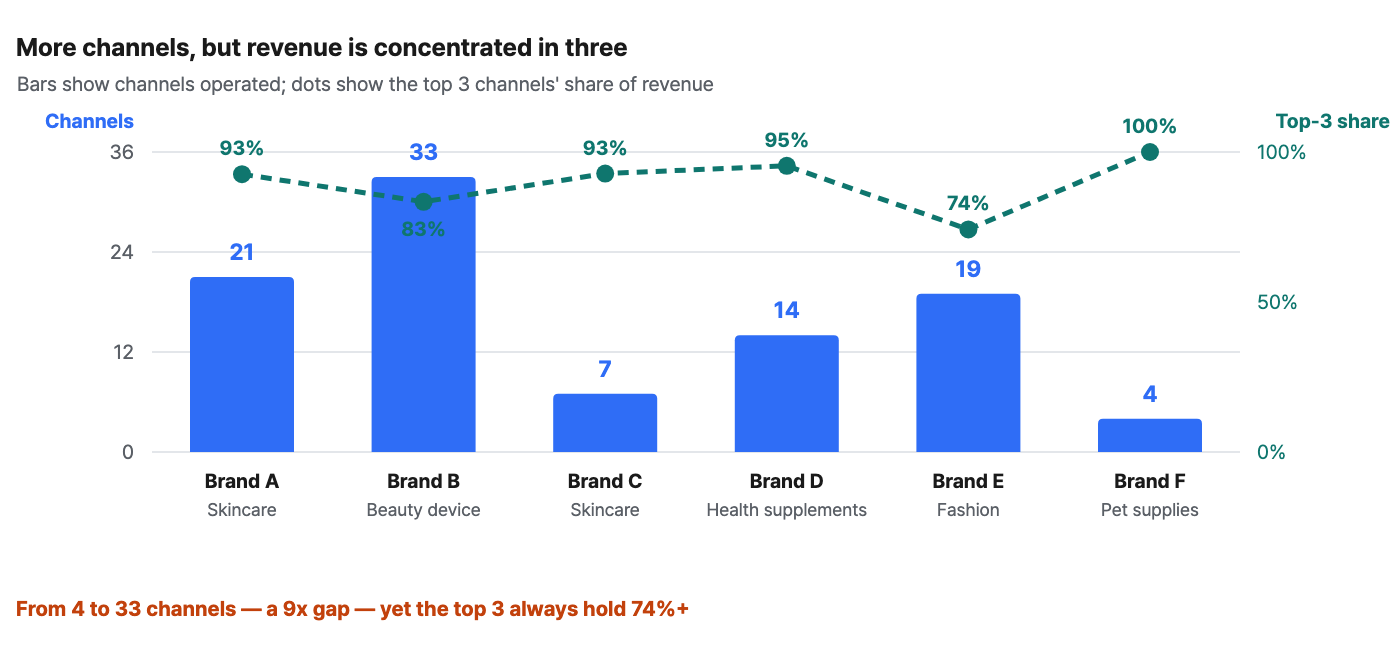
We took apart the channel mix of six brands. The number of channels they operate ranges from 4 to 33 — a 9x spread — yet
We took apart the channel mix of six brands. The number of channels they operate ranges from 4 to 33 — a 9x spread — yet at every brand, the top 3 channels accounted for at least 74% of revenue. The problem is that aggregation work scales with the number of channels, not with revenue: the median brand has 10 channels that each bring in less than 1% of revenue, and every one of those admin consoles still has to be opened one by one.
6 commerce brands · 12-month window · mixed categories (2 skincare · 1 beauty device · 1 health supplement · 1 fashion · 1 pet supplies). For each part, we also note the Laplace screen and settings where you can see that number.
The figures in this report are not actual transaction data; they are illustrative values generated to reflect the distribution of Laplace benchmark metrics. They do not represent any specific customer, so please use them to understand trends rather than as absolute values.
PART 01 · First — which screen to open
| Menu | Screen | Which number in this report | Priority |
|---|---|---|---|
| Data Management | Connected channel list · connection status | Number of channels operated, collection method (automatic/manual) | 1st |
| P & L Analysis | P&L by channel | Revenue share by channel · top-3 channel concentration | 1st |
| Product Analysis | Product-level analysis | Channel × product P&L on the same base-product basis | 2nd |
| Custom Dashboard | Integrated revenue trend across channels | Turn a once-a-month manual roll-up into an always-on metric | 2nd |
| User Analysis | First purchase / repurchase | Validating each channel's role (acquisition / profit) | 3rd |
This report is not telling you to "cut channels"
PART 02 · Start with a self-check — if your answer to Q1 is "a week or more"
-
How many days does it take to see your integrated revenue across all channels? (same day / 1–2 days / a week or more)
-
Have you ever calculated, on a monthly basis, how much time your team spends collecting channel data and reconciling settlements?
-
Can you say what "revenue" means on each channel (order date / purchase confirmation / net of refunds)?
-
In the last 6 months, have you found formula errors or missing data in your manually compiled Excel files?
If your answer to Q1 is "a week or more" and to Q4 is "yes," the problem isn't your team's skill — it's the structure. A system in which people hop between admin consoles and copy-paste numbers together is inherently slow and inherently error-prone.
| Study | Confirmed figure |
|---|---|
| Payoneer global seller data | Multichannel sellers saw revenue +34%; single-channel sellers −25% |
| Commerce report from a major Korean marketplace | 55% of sellers on that marketplace already run other marketplaces in parallel |
| Treasure Data | Marketing teams spend an average of 14.5 hours a week managing and aggregating data |
| Panko's spreadsheet audit research | Errors found in 91–94% of hand-merged spreadsheets |
So far, these are other people's numbers
Next screen — First, let's see how many channels "multichannel" actually means. ›
PART 03 · Priority 1 — Channels have multiplied, but revenue is concentrated in three
The figures in this report are not actual transaction data; they are illustrative values generated to reflect the distribution of Laplace benchmark metrics. They do not represent any specific customer, so please use them to understand trends rather than as absolute values.
Where to look in Laplace — Data Management › Connected channel list · connection status
| Channels operated (median) | Top-3 channel revenue share (median) | Long-tail channels under 1% of revenue (median) | Revenue from those channels (median) |
|---|---|---|---|
| 16 | 92.7% | 10 | 2.7% |
| Brand | Category | Channels | #1 share % | Top-3 share % | Long-tail channels | Long-tail revenue % | Manual channels | Manual revenue % | Monthly aggregation hours |
|---|---|---|---|---|---|---|---|---|---|
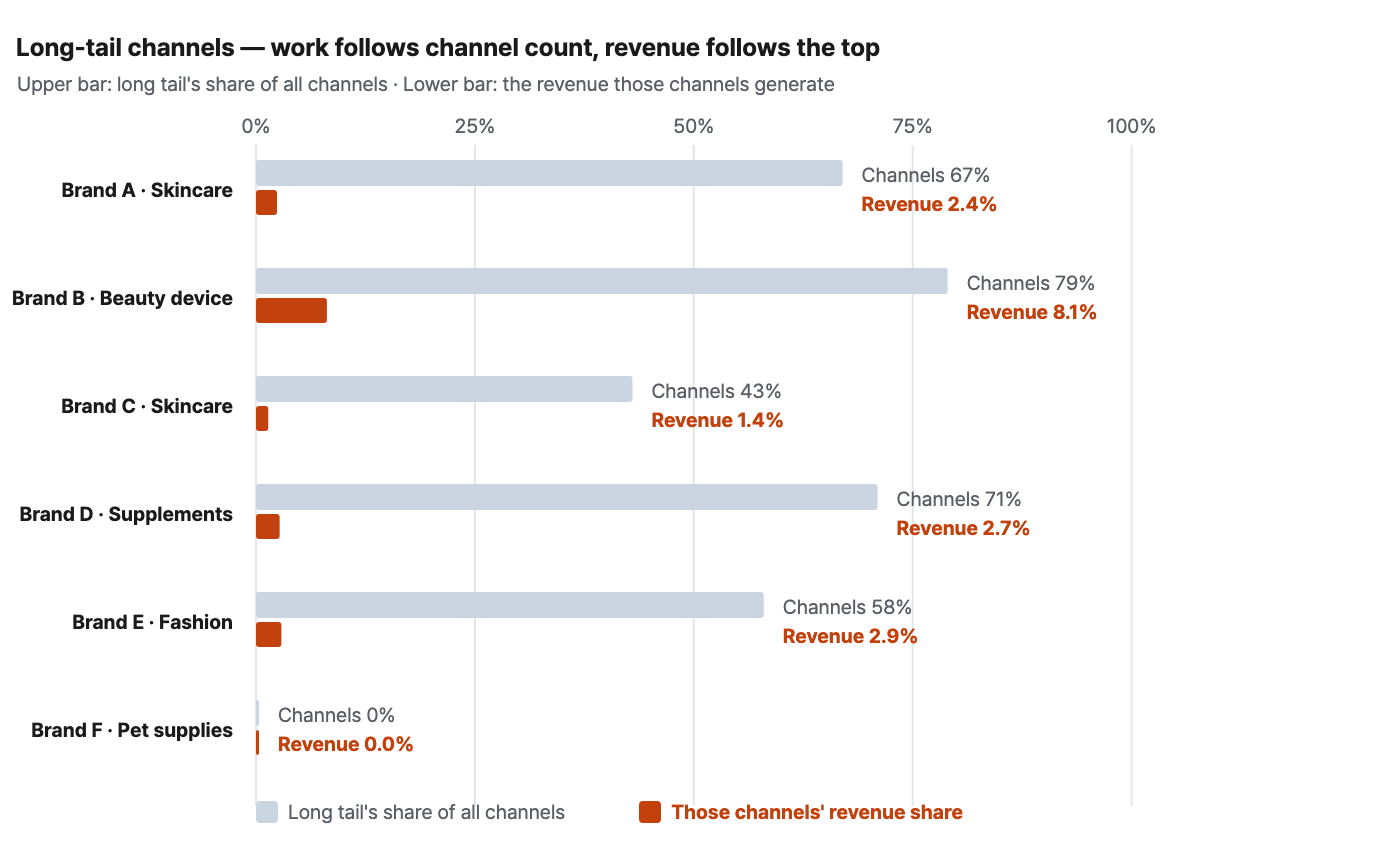
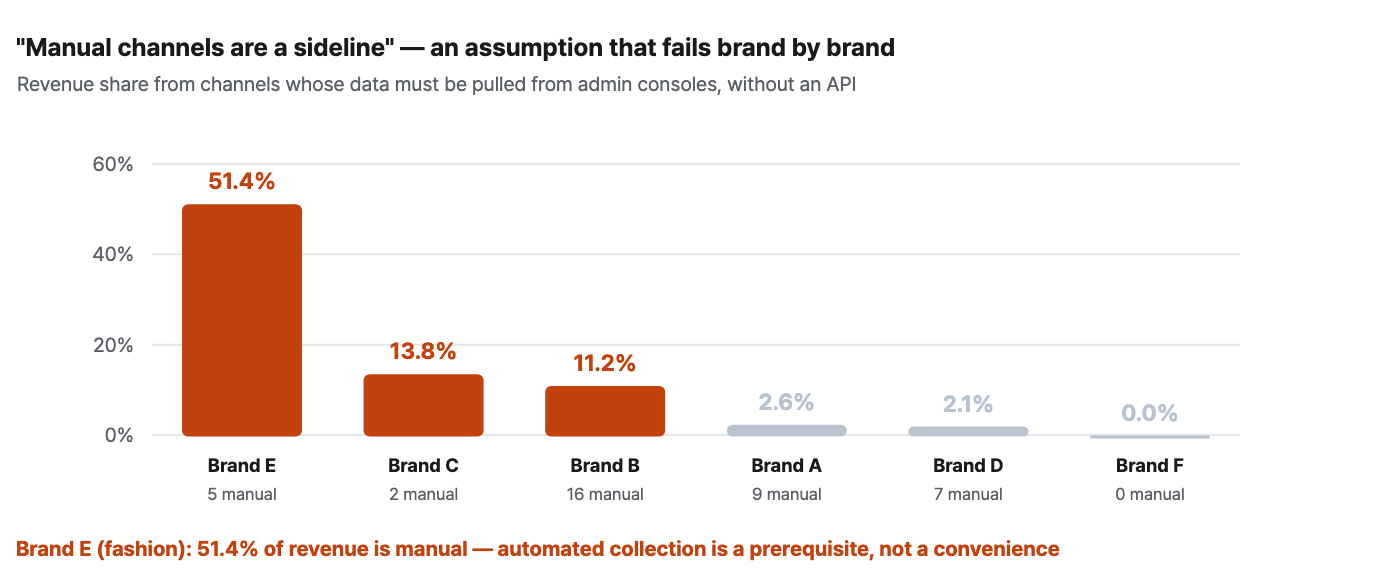
| Brand A | Skincare | 21 | 34.8 | 92.6 | 14 | 2.4 | 9 | 2.6 | 52 |
| Brand B | Beauty device | 33 | 71.9 | 83.4 | 26 | 8.1 | 16 | 11.2 | 64 |
| Brand C | Skincare | 7 | 68.4 | 92.8 | 3 | 1.4 | 2 | 13.8 | 28 |
| Brand D | Health supplements | 14 | 56.1 | 95.4 | 10 | 2.7 | 7 | 2.1 | 35 |
| Brand E | Fashion | 19 | 38.6 | 74.2 | 11 | 2.9 | 5 | 51.4 | 53 |
| Brand F | Pet supplies | 4 | 60.7 | 100.0 | 0 | 0.0 | 0 | 0.0 | 25 |
How to read these numbers
Next screen — Let's visualize the long-tail imbalance. On to PART 04. ›
PART 04 · Work follows channel count; revenue follows the top 3
How to read these numbers
This doesn't mean you should shut down long-tail channels
Next screen — Now let's see which channels are collected manually. ›
PART 05 · "Manual channels are just a side issue" — an assumption that breaks brand by brand
How to read these numbers
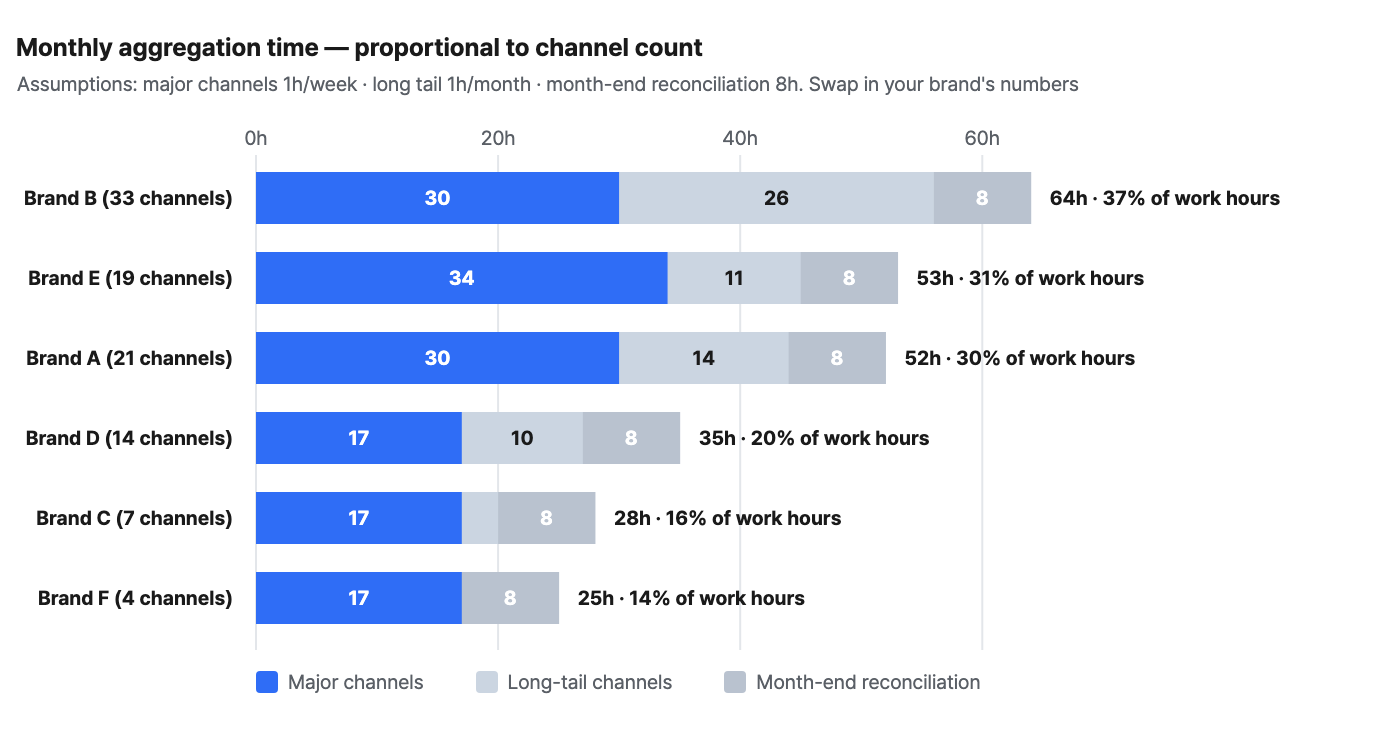
Median monthly aggregation time: 44 hours — 25% of working hours
Next screen — Time isn't the only problem. There's also the issue of combined numbers that simply don't add up. On to PART 06. ›
PART 06 · Pitfalls — collecting data without unifying definitions only gets you halfway
Pitfall ① "Revenue" means something different on every channel
Order-date revenue or confirmed-purchase revenue, refunds reflected or not, which line fees sit on, VAT included or not — it all varies by channel. In a previous report, we measured the gap between order revenue and confirmed revenue for the same brand by channel type, and this is how wide it got.
| Channel type | Order → confirmed gap |
|---|---|
| Overseas own store | 0.7% |
| Fashion vertical | 8.2% |
| Own store | 9.8% |
| Marketplace | 8.0% |
| Major platform fulfillment | 22.8% |
Same period, same brand — yet the gap ranges from 0.7% to 22.8%. Add them up without unifying definitions and you get a total that's useless for anything. Before building "integrated revenue," first decide which point in time you'll standardize on.
Pitfall ② Even within a single channel, sales, settlement and ad data are scattered
To say you've "collected everything" for one channel, you need to pull from four places: sales, settlement, ads and logistics. As we saw in a previous report, some channels have their biggest cost outside the settlement statement — collect only settlement data and you miss ad spend, the largest cost layer, entirely.
Pitfall ③ Even with automation, the first month needs reconciliation
Even once collection is automated, you still need to put the numbers side by side with the channel admin and check for differences in definitions. If refund timing, VAT treatment or fee accounting are misaligned, automated numbers will be wrong too. You only need to do this reconciliation once — after that, the standard holds.
| Check item | Standard | If you skip it |
|---|---|---|
| Unify the revenue definition | Same refund/cancellation timing across all channels | A total you can't actually use |
| Collection scope per channel | All four: sales · settlement · ads · logistics | The largest cost layer goes missing entirely |
| Unify the product basis | Map each channel's product names to base products | No way to compare P&L by channel × product |
| First-month consistency check | 1:1 reconciliation against channel admin numbers | Automated numbers lock in their errors |
| Collection delay monitoring | Check collection status whenever a channel revamps its admin | Several days of data silently go missing |
Action plan · A 4-week execution sequence
| Week | What to do | Done when |
|---|---|---|
| W1 | List every channel you operate and add revenue share · collection method (automatic/manual). Also actually measure the time asked about in the self-check above | Channel list table · your brand's monthly aggregation hours |
| W2 | Settle on a single revenue definition and apply it to all channels. Reconcile 1:1 against channel admin numbers | Definition document · reconciliation results by channel |
| W3 | Map each channel's product names to base products. Target a 95% mapping rate | Base product match rate · first channel × product P&L table |
| W4 | Build an integrated channel dashboard — revenue rank and margin rank side by side. Document the operating purpose of each long-tail channel | Always-updated dashboard · keep-or-close decision for long-tail channels |
Summary · Five sentences
-
Channel counts differ 9x, but the revenue structure is similar. At every brand, the top 3 channels generate at least 74% of revenue (median 92.7%).
-
The long tail is a median 67% of all channels but just 2.7% of revenue. Yet aggregation work tracks channel count, not revenue.
-
The weight of manual channels ranges from 0.0% to 51.4% depending on the brand. Start by checking the assumption that "only minor channels are manual."
-
Median monthly aggregation time is 44 hours — 25% of working hours. The gap between the highest and lowest came down not to skill but to channel count.
-
Unifying definitions is harder than collecting the data. Even within the same brand, the order↔confirmed gap ranges from 0.7% to 22.8% by channel type.
Reproduction settings · The minimum setup to regenerate this report as is
| Item | Value | Why |
|---|---|---|
| Channel list | Exclude channels with zero revenue; 12-month window | Dormant channels inflate the channel count |
| Long-tail threshold | Revenue share under 1% | Adjustable per brand. A 2% threshold captures more channels |
| Revenue definition | Net sales after refunds/cancellations, identical across all channels | If definitions differ, even the share calculation goes wrong |
| Collection method classification | Automatic integration / manual aggregation | You need this split before you can calculate the effect of automation |
| Aggregation time model | Major channels 1h/week · long tail 1h/month · month-end close 8h | Assumed values. Measure for just one month to get your own numbers |
| Unit of comparison | Compare brands by ratio | Absolute hours aren't comparable across brands of different sizes |
FAQ · Frequently asked questions
Q. Is cutting channels the answer?
No. Multichannel selling has been shown again and again to be good for revenue. The problem isn't the number of channels but a structure in which work per channel grows linearly. What you should cut isn't channels — it's aggregation time per channel.
Q. Should we shut down long-tail channels?
Keep them if their operating purpose is documented; if not, they're candidates for cleanup. If there's a purpose — entering a new market, reaching a specific customer segment, brand exposure — the right move is to automate aggregation and keep them running without manual work. Start by counting how many channels were simply "opened a while back" with no purpose.
Q. What should we decide first when building integrated revenue?
The point in time that defines revenue. Choose either the order date or the confirmation date and apply it to all channels. In this sample, the order↔confirmed gap ranged from 0.7% to 22.8% by channel type — if you don't align the definition, that entire gap becomes error.
Q. How do we quantify the effect of automation?
Before rollout, record "number of channels × weekly aggregation hours + monthly close reconciliation hours," then measure the same items again after rollout. Add the number of errors you used to catch in manual aggregation, and you have a figure you can report.
Q. If collection is automatic, can we leave it completely alone?
The first month's consistency check still remains. Put the numbers side by side with the channel admin and check for differences in refund timing and VAT treatment. And because collection can be temporarily delayed when a channel revamps its admin, ongoing collection status monitoring is still needed.
References: Payoneer global seller data · Commerce report from a major Korean marketplace · Treasure Data · Panko Spreadsheet Research
The figures in this report are not actual transaction data; they are illustrative values generated to reflect the distribution of Laplace benchmark metrics. They do not represent any specific customer, so please use them to understand trends rather than as absolute values. Figures from public research cite their sources in each item. Screen and setting names may differ slightly depending on the release.