H1 2026 D2C Performance Benchmark Report
“Our ROAS is 2.7x. Is that actually good?”
“Our ROAS is 2.7x. Is that actually good?”
You can’t tell whether your repurchase rate is low or high, and you can’t decide whether to increase your ad spend or pull back. If you run a D2C brand, you have almost certainly wrestled with these questions. Going on gut feel is risky, and without a benchmark to compare against, it’s hard to be confident in any decision.
Laplace Analytics analyzed H1 2026 data from 339 D2C brands actually connected to the platform — KRW 1.3 trillion in total GMV, 12.52 million orders and 9.44 million buyers — and published the H1 2026 D2C Commerce Benchmark Report. Find out exactly where your brand stands, based on data rather than instinct.
5 in 10 brands grew, 3 in 10 declined — polarization has sharpened
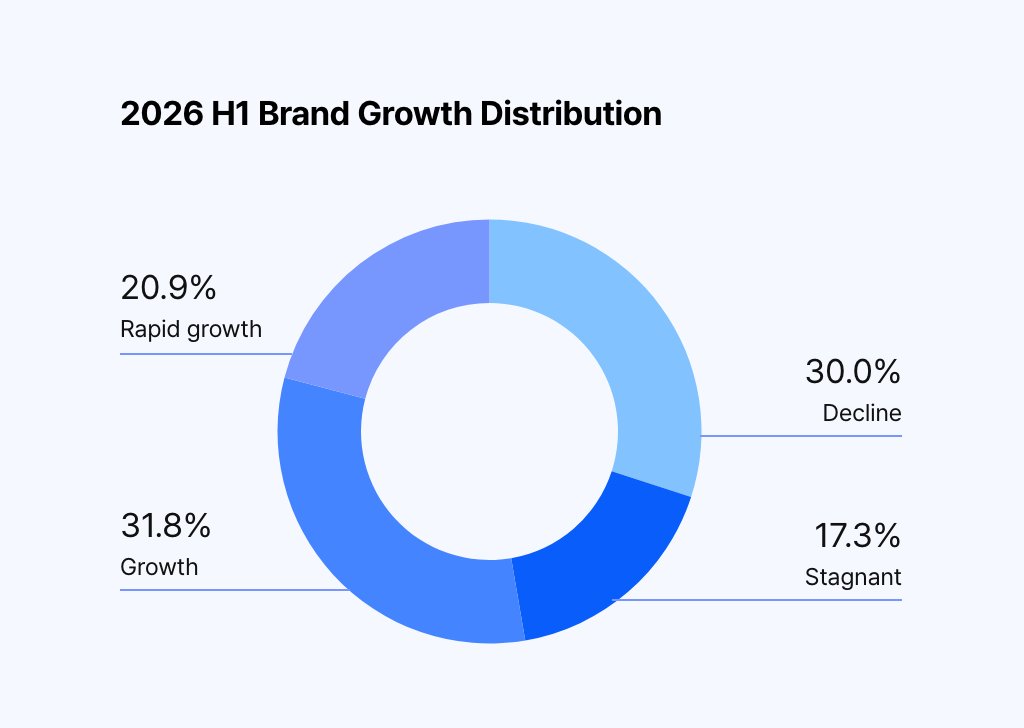
In H1 2026, 52.7% of Laplace customer brands grew. 20.9% of them grew more than 2x year over year, with a median growth rate of a remarkable +234.2% and the top 25% reaching +1,840.6%. That’s good news, but a closer look tells a different story. On the other side, 30.0% of brands saw sales fall by 10% or more, with a median decline of -23.7%. A gap this wide in the same market over the same period means a polarized structure has taken hold: "brands that do well keep doing better, and brands that struggle keep struggling."
- So what is the decisive difference between fast-growing brands and those that are stagnating or declining?
Brands in the KRW 5–10 billion band are growing most steadily
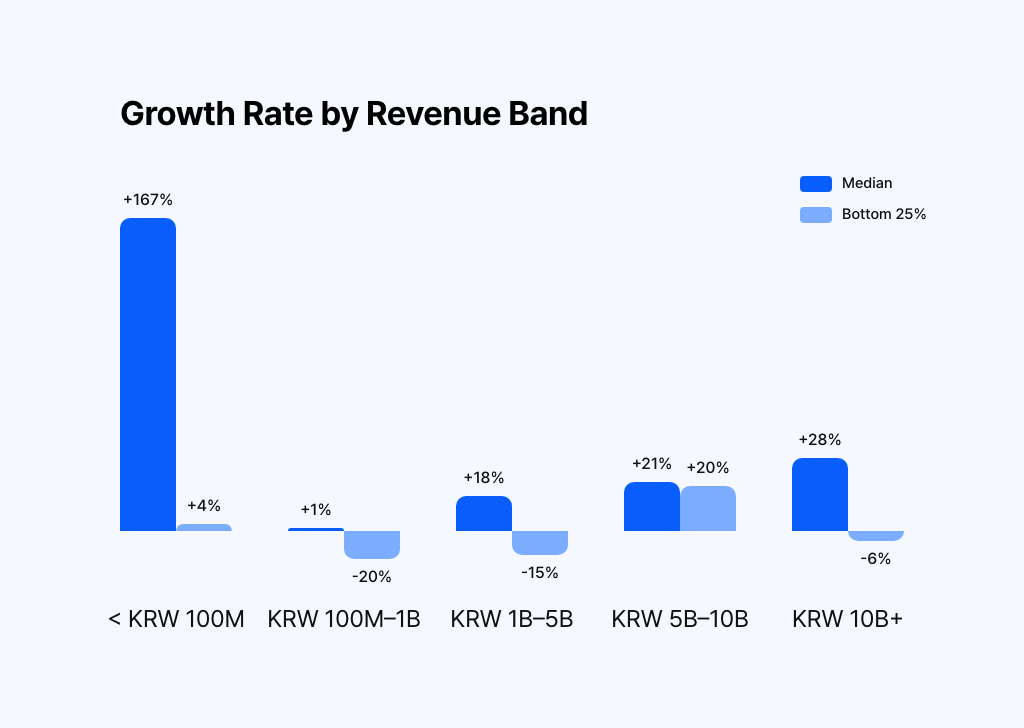
Breaking the data down by revenue band reveals an interesting pattern. Early-stage brands under KRW 100 million show explosive growth, with a median of +167.3%, but extreme volatility. Surprisingly, the most stable band was KRW 5–10 billion: even its bottom 25% grew +20.1%, so every quartile posted positive growth. By contrast, the most crowded band, KRW 100 million–1 billion (150 brands), had a median of just +1.3% and a bottom quartile of -19.9%, with nearly half of its brands shrinking — a true "growth death valley." Large brands above KRW 10 billion, despite their scale, are still sustaining healthy growth of +27.9%.
- What does top-25% growth look like in your brand’s revenue band? See the detailed figures for every band in the report.
Median ROAS of 2.7x — it’s not "just us"; it’s the new normal across the industry
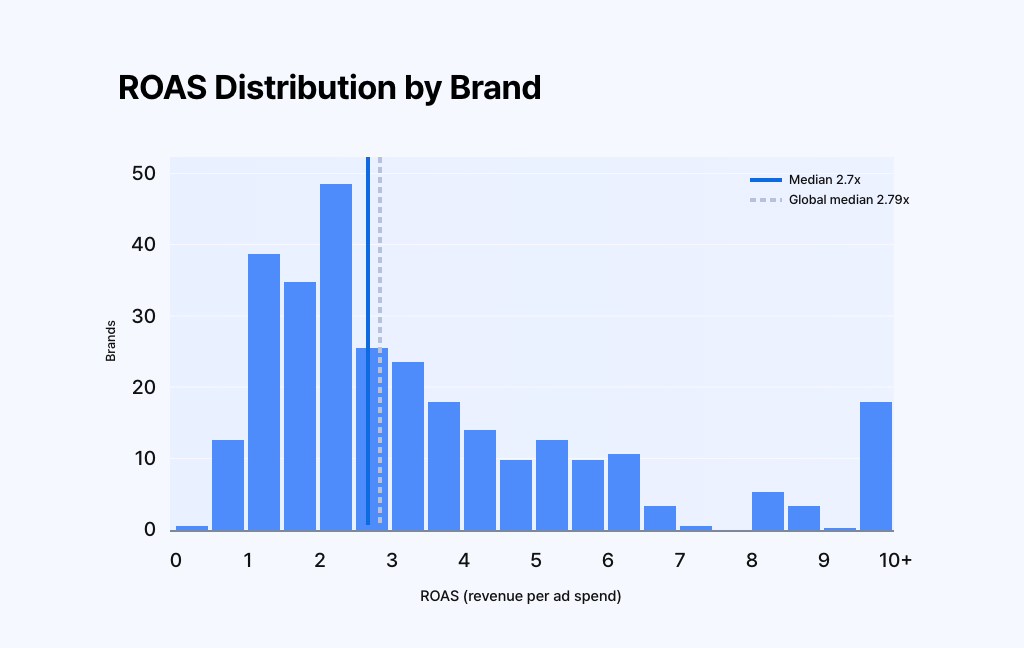
ROAS is the metric D2C brands watch most closely. The median ROAS across all brands was 2.7x, with the top 25% at 4.4x and the bottom 25% at 1.8x. That may look low, but the key point lies elsewhere: the 2026 global e-commerce median Meta ROAS is 2.79x — virtually identical to our sample. This is the new normal in an era of costly automated bidding, where CPMs have risen structurally by about +20% year over year and the average creative lifespan has shrunk to 8.4 days. It’s not that "only we got worse"; we’ve entered an era where you need to look beyond ROAS to profit-based metrics like MER and POAS.
- If your ROAS is below 1.8x, or your spend is heavily concentrated in high-commission channels, you are likely operating below breakeven. Where does your brand’s ROAS fall? The report includes a formula for redefining your breakeven ROAS.
Core customers are women in their 30s–50s, and the repeat-purchase structure is solid
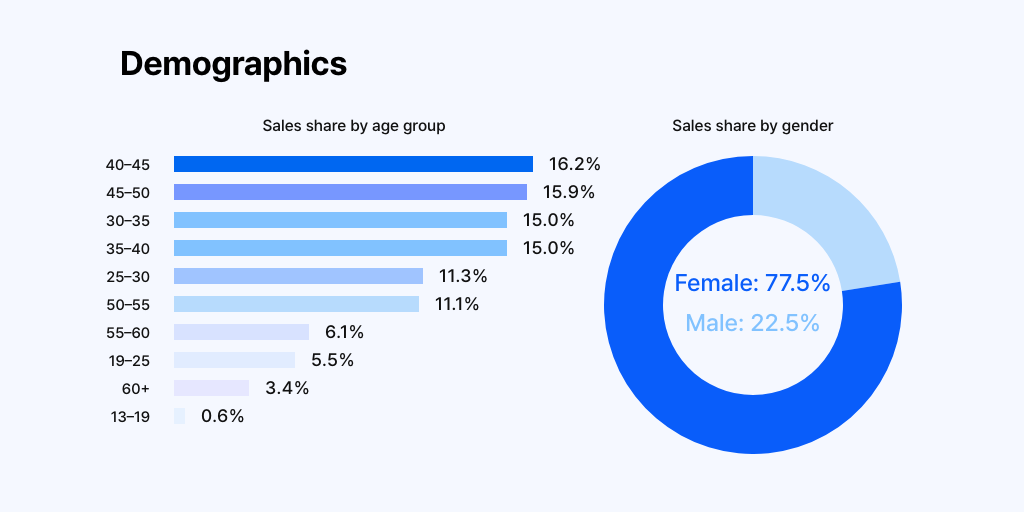
The ARPPU/AOV ratio is 1.34x, meaning the repeat-purchase structure is holding, with each customer buying about 1.3 times per half-year on average. Median AOV is KRW 64,083, and the 2.2x gap between the top 25% (KRW 98,701) and the bottom 25% (KRW 44,932) shows there is meaningful room to lift order value through product bundling alone. By customer mix, women account for 77.5% of sales, and customers in their 40s–50s are the single largest contributors to revenue. This age group is easily overlooked in digital marketing, so reaching them through Kakao Channel and SMS CRM can significantly improve your repurchase rate.
- Is your brand’s AOV in a healthy range? The report covers how to design free-shipping thresholds and how to optimize LTV relative to CAC.
Naver Search Ads is the most widely used channel, but the one to watch is elsewhere
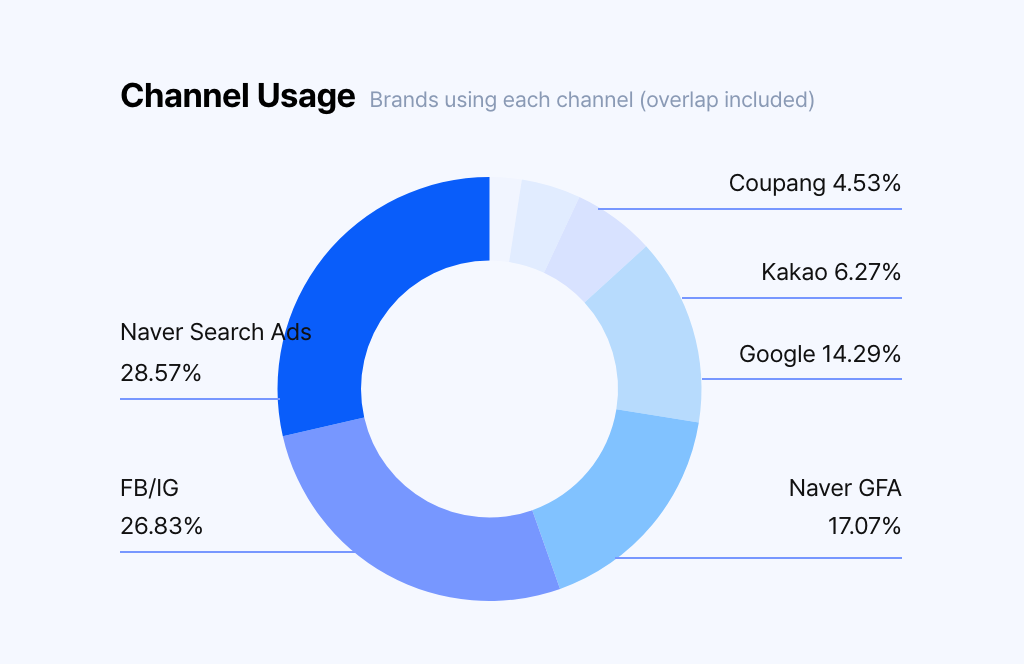
By channel, Naver Search Ads is the most widely used, at 246 brands, while FB/Instagram, despite losing some advertisers, still ranks first in ad spend. What stands out is the rise of emerging channels. Coupang Ads has emerged with 39 brands, underscoring the growing importance of advertising inside marketplaces, and while only 21 brands use TikTok so far, most of them fall into the fast-growth group. And with a median direct-conversion share of just 25.8% of ad-attributed revenue, the data shows that ads explain only part of total sales — and how important it is to build your own channels and CRM.
- Explore the detailed data in the report: ad spend share and brand count by channel, and direct vs. indirect conversion performance.
Overall Performance Matrix: Find your position across 14 key metrics
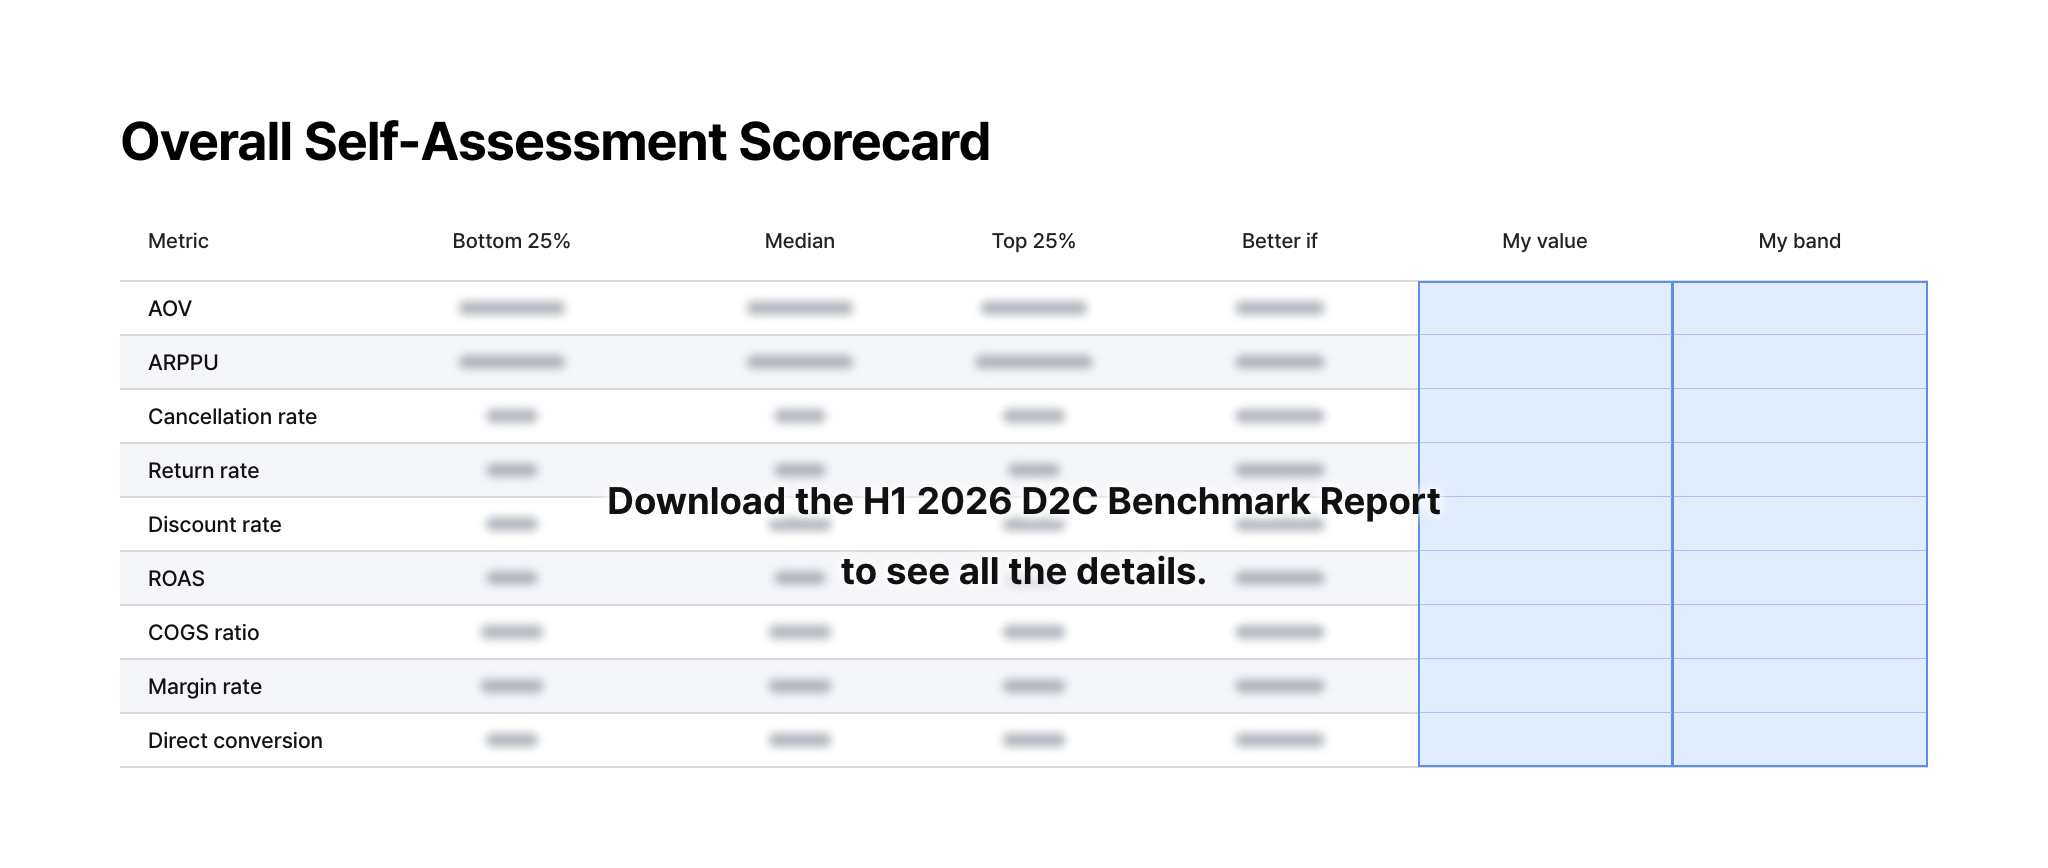
The report provides bottom-25% / median / top-25% benchmarks for 14 key metrics: growth rate, AOV, ARPPU, cancellation rate (median 6.5%), return rate (0.6%), discount rate (13.1%), COGS ratio (24.0%), margin rate (76.8%), ROAS, CPC (KRW 693), CPM, CTR (1.25%), and direct/indirect conversion shares. It also includes global Meta benchmarks by category, a breakeven-ROAS self-assessment scorecard, and four key strategies for H2 2026 (adapting to the new ROAS normal, systematizing creative rotation, defending AOV and managing cancellation rates). Get the full picture in the report.
Get the report free today
Built on real data from 339 brands, the H1 2026 D2C Commerce Benchmark Report is designed to help you objectively assess where your brand stands today and build a data-driven growth strategy. Plan your brand’s next move with numbers, not gut feel.
👉 Download the H1 2026 D2C Commerce Benchmark Report for free →
This report is based on data from brands connected to Laplace Analytics. All data has been anonymized and aggregated, so no individual brand can be identified.