Our No. 1 Revenue Channel Had the Lowest Margin — How to Calculate Net Margin by Channel
We ranked the same channels twice — once by revenue, once by net margin rate — and the rankings came out almost perfectl
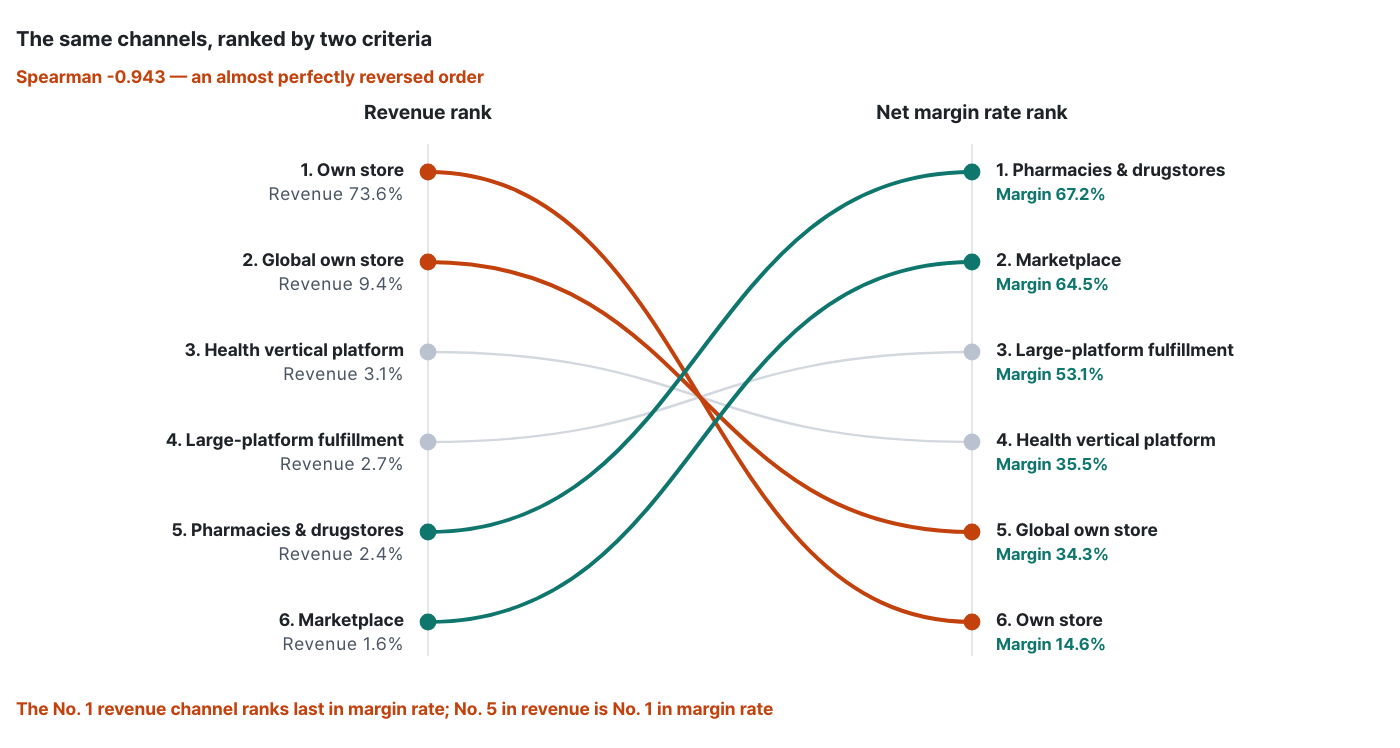
We ranked the same channels twice — once by revenue, once by net margin rate — and the rankings came out almost perfectly reversed (rank correlation -0.943). The own store, which generates 73.6% of revenue, came dead last with a 14.6% margin rate, while a channel with just 2.4% of revenue ranked No. 1 at 67.2%. The deciding factor wasn't fees. It was the ad spend attributed to each channel.
Sample data for a commerce brand · 12 months · approx. 380,000 orders / approx. 310,000 buyers · 7 channel groups. For each section, we also note the Laplace screen and settings where you can see that number.
The figures in this report are not real transaction data. They are illustrative values generated to reflect the distribution of Laplace benchmark metrics. They do not represent any specific customer, so please use them to understand trends rather than as absolute values.
PART 01 · First — which screens to open
You don't need to go through every menu. We picked only the screens that produce the numbers in this report.
| Menu | Screen | Which number in this report | Priority |
|---|---|---|---|
| P & L Analysis | P&L by Channel | Net margin rate by channel · share of margin contribution | Priority 1 |
| Data Management | Channel & Ad Account Integration | The prerequisite for attributing ad spend to channels | Priority 1 |
| Data Management | Base Product & COGS Registration | The COGS layer — without it you only get gross profit, not net margin | Priority 1 |
| P & L Analysis | P&L by Payment Method | Effective payment fee rate for the own store | Priority 2 |
| User Analysis | First Purchase / Repurchase | Validating channel roles — does the acquisition channel really acquire? | Priority 2 |
| Ad Analysis | Traffic Analysis | Attributing ads that drive traffic to the own store back to the own store | Priority 2 |
| Custom Dashboard | Margin rate trend chart by channel | Early detection of channels whose margins are stepping down | Priority 3 |
The hard part isn't the math — it's gathering the data
PART 02 · Start with a self-check — if you get stuck on even one of these four
-
Can you state each channel's net margin rate (after all fees and ad spend) as an actual number right now?
-
Have you ever checked whether your revenue ranking and net margin ranking match?
-
Do you manage ad spend attributed by channel, or only as “total ad spend this month”?
-
Have you calculated the break-even point for what percentage you can spend on promotions that steer customers to your own store and still come out ahead?
Each channel has different cost “layers”
| Cost layer | Own store | Marketplaces · platforms | Offline · pharmacy distribution |
|---|---|---|---|
| ① Sales (marketplace) commission | None | Yes — varies by category | None (wholesale purchase model) |
| ② Payment (PG) fee | Yes — varies by payment method | Often included in the sales commission | Not applicable |
| ③ Logistics · fulfillment | In-house shipping costs | Charged separately when using fulfillment | Built into the supply price |
| ④ Advertising · promotions | Traffic acquisition ad spend | In-channel ad spend + promotion cost sharing | Listing fees · event cost sharing |
Two things matter here. First, even the same “fee” covers different things on different channels. To compare the own store's single-digit payment fee with a platform's double-digit sales commission on the same line, you have to unpack all four layers and rebuild them on a common basis.
Second, on some channels the biggest cost layer sits outside the settlement statement. Ad spend is often billed separately from settlements. If you only collect settlement statements, you end up with a “fake net margin” that leaves out the single largest cost layer — advertising — entirely.
This article contains no industry benchmarks
Next screen — we have the framework. Now let's see whether the rankings actually flip.
PART 03 · Priority 1 — rank channels by two criteria and the order flips
Brand D is a Korean health supplement brand. Its own store accounts for three-quarters of revenue, and it also sells through a global own store, a health vertical platform, large-platform fulfillment, pharmacy distribution, and marketplaces. Because opened products are hard to return in this category, it's the cost structure, not claims, that determines margin.
Before you read the numbers
Where to find it in Laplace — P & L Analysis › P&L by Channel
How to set it up
-
Standardize the revenue basis on net sales, reflecting refunds and cancellations. If some channels use order date and others use purchase-confirmation date, you're comparing different numbers from the very first row.
-
Connect every ad account. If ad spend isn't attached to channels, this report's conclusions disappear entirely.
-
Set the date range to 12 months, so that a single seasonal event on one channel doesn't shake up the rankings.
-
Switch the sort to net margin rate. This one click is what this entire report is about.
| Correlation: revenue rank × margin rate rank | Correlation: revenue rank × net margin amount rank | Margin rate of the No. 1 revenue channel | Margin rate gap between channels |
|---|---|---|---|
| -0.943 | 0.771 | 14.6% (last) | 52.6pp |
| Channel | Revenue share % | Sales & payment fees | Channel-attributed ad spend | COGS | Net margin rate | Margin contribution share % | Gap (pp) |
|---|---|---|---|---|---|---|---|
| Own store | 73.6 | 5.4 | 48.2 | 31.8 | 14.6 | 49.0 | -24.6 |
| Global own store | 9.4 | 0.0 | 41.6 | 24.1 | 34.3 | 14.7 | +5.3 |
| Other small channels | 7.2 | 8.8 | 22.4 | 30.1 | 38.7 | 12.7 | +5.5 |
| Health vertical platform | 3.1 | 27.2 | 8.4 | 28.9 | 35.5 | 5.0 | +1.9 |
| Large-platform fulfillment | 2.7 | 19.3 | 0.0 | 27.6 | 53.1 | 6.5 | +3.8 |
| Pharmacies & drugstores | 2.4 | 0.0 | 4.6 | 28.2 | 67.2 | 7.4 | +5.0 |
| Marketplace | 1.6 | 6.1 | 0.0 | 29.4 | 64.5 | 4.7 | +3.1 |
Net margin rate = 100 − sales & payment fees − channel-attributed ad spend − COGS (channel net sales = 100). Margin contribution share = net margin generated by the channel ÷ total net margin.
How to read the numbers
-
The revenue ranking and the margin rate ranking are in almost exactly reverse order. Rank correlation is -0.943 — the own store, No. 1 in revenue, is No. 6 in margin rate, while pharmacy distribution, No. 5 in revenue, is No. 1 in margin rate.
-
What flips is the “rate,” not the “amount.” The correlation between the net margin amount ranking and the revenue ranking is still high at 0.771. A channel with an overwhelming share of revenue still ranks No. 1 in absolute terms even with a thin margin rate. That's why you need to look at both metrics together — the amount tells you about scale, the rate tells you about efficiency.
-
The margin rate gap is 52.6pp. From 14.6% to 67.2%. Same brand, same products — yet the money you keep differs by more than 4x depending on where you sell.
Next screen — we know the rankings flip. But we still can't see which layer flipped them.
PART 04 · It wasn't fees that flipped the rankings — it was ad spend
How to read the numbers
-
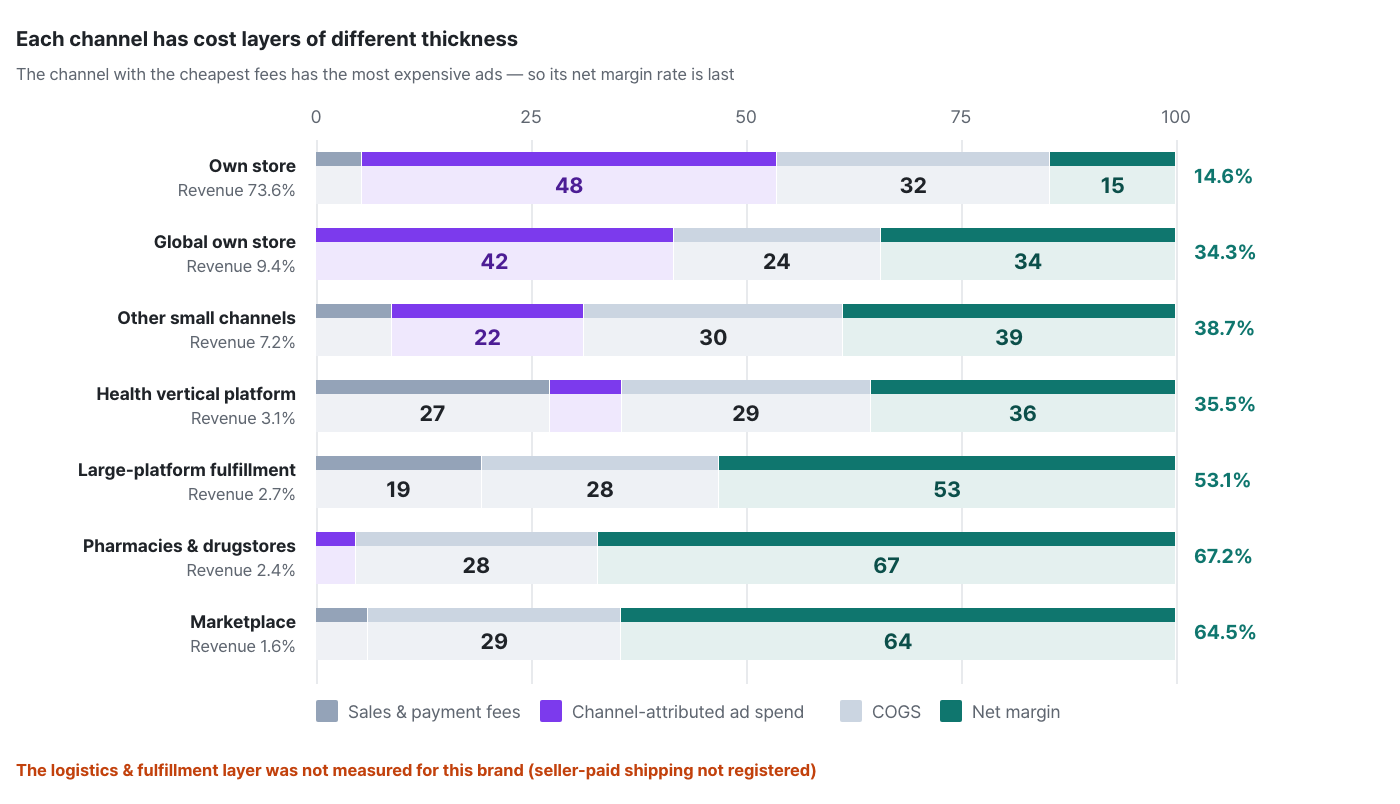
The channel with the cheapest fees has the most expensive ad spend. The own store's fees are 5.4% — one-fifth of the health vertical platform's (27.2%) — but its ad spend is 48.2%, 5.7x that channel's (8.4%). As a result, the margin rates flip: 14.6% vs 35.5%.
-
Platform fees are also the “price of traffic.” A channel that charges no fees has to buy its own traffic, and for this brand, buying it turned out to be more expensive. Before deciding to “shift sales to the own store because the fees hurt,” look at this table first.
-
Channels that don't use ads have overwhelmingly higher margin rates. Pharmacy distribution is at 67.2%, marketplaces at 64.5%. But combined, they account for only 4.0% of revenue — the channels with high margin rates and the channels that drive scale are not the same.
-
The COGS layer barely differs between channels (24.1–31.8). That's to be expected when you're selling the same products. The only layers you can move are fees and ad spend.
Next screen — we know which layer is the problem. Next: what decisions this table drives.
PART 05 · Three decisions you can make from this one table
Decision ① Reallocating the ad budget — stop using “revenue rank” as the yardstick
-
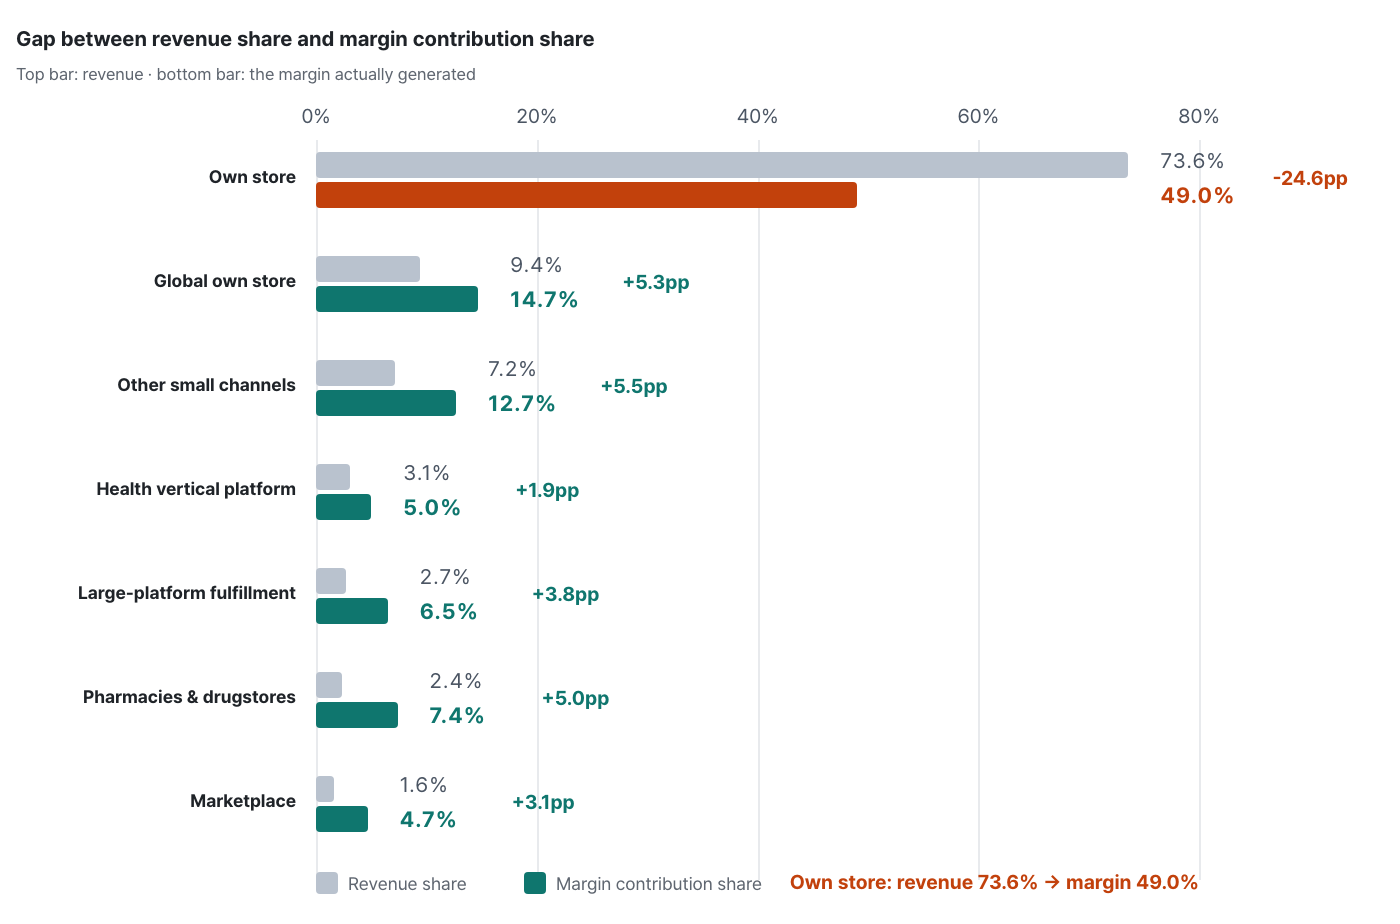
The own store generates 73.6% of revenue but only 49.0% of margin (-24.6pp). Every other channel contributes a larger share of margin than of revenue.
-
The top priority for budget increases is “channels with high margin rates but a small share of revenue.” In this table, that means pharmacy distribution, marketplaces, and fulfillment — all three spend 4.6% or less on ads, yet their margin rates are 53.1% or higher.
-
For the own store, improving ad efficiency has to come before any budget increase. Under the current structure, putting more budget into the own store just grows revenue that earns a 14.6% margin.
Decision ② Defining each channel's role — but you need evidence
Not every channel has to be a profit channel. A channel with thin margins but strong new-customer inflow can be classified as an “acquisition channel,” while one with thick margins becomes a “profit channel.” That turns the argument “why is this channel's margin so bad?” into “how is it performing against its role?”
However, to label a channel as an acquisition channel, you need to confirm that the customers it brings in actually repurchase. For this brand, that confirmation was only possible for half the picture.
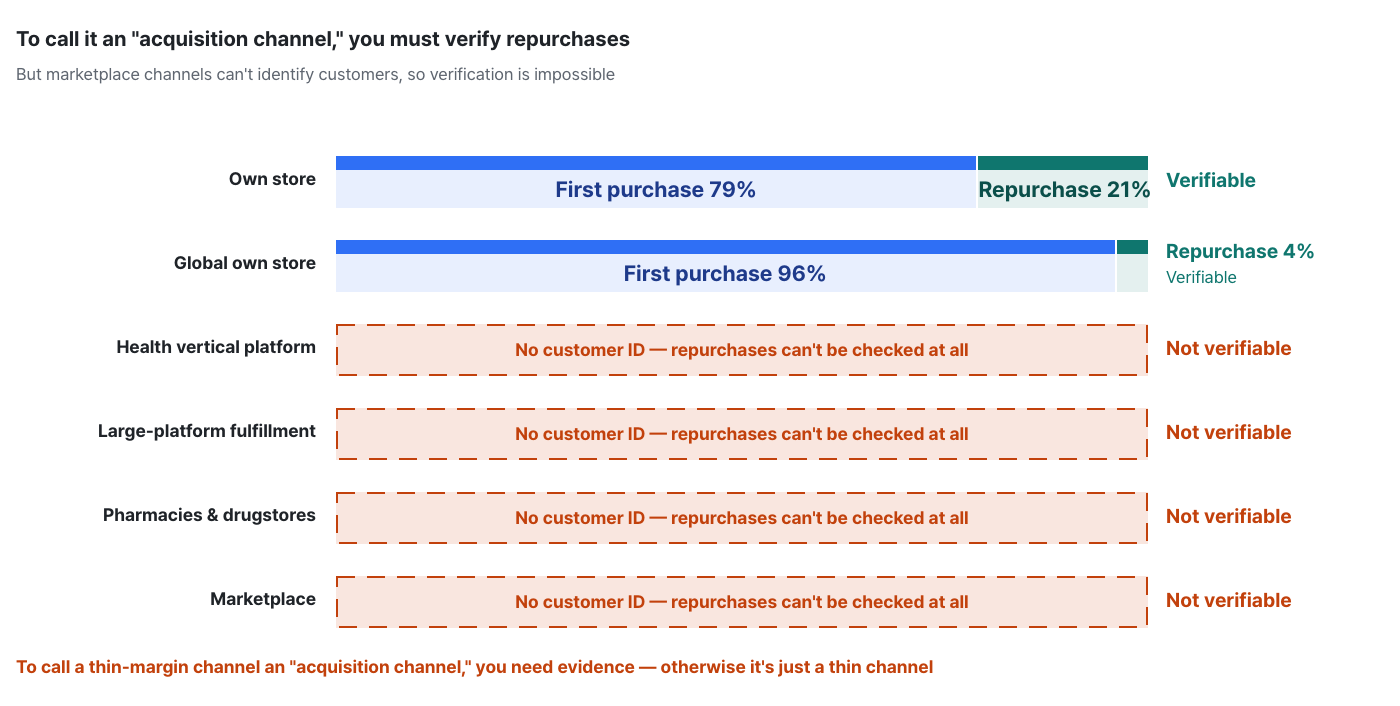
On marketplace channels, repurchases can't be verified at all
Decision ③ Break-even for promotions that steer customers to the own store — this brand was the opposite
The usual advice goes like this: “If the margin rate gap between marketplaces and your own store is 8pp, you can spend 3–4% of revenue on own-store-only reward points and still come out ahead.” That only holds when the gap favors the own store.
| Comparison | Own store margin rate | Other channel margin rate | Gap | Room to steer to own store |
|---|---|---|---|---|
| vs pharmacies & drugstores | 14.6% | 67.2% | -52.6pp | None |
| vs marketplaces | 14.6% | 64.5% | -49.9pp | None |
| vs large-platform fulfillment | 14.6% | 53.1% | -38.5pp | None |
Every gap is negative — under the current structure, the more you steer, the more you lose
Next screen — all three decisions rest on the assumption that the table is accurate. There are three traps people fall into when building this table for the first time.
PART 06 · Traps — skip these three checks and your table will be wrong
Trap ① The logistics & fulfillment layer is completely empty
For this brand, seller-paid shipping costs are recorded as zero on every channel — because they were never entered. So the cost layers in the table above are only three (fees, ad spend, COGS); the fourth layer discussed in PART 02 was never measured.
The impact differs by channel. The own store, which handles its own shipping, actually has a margin rate even lower than the table shows, while for channels using fulfillment the cost is already included in fees, so the difference is small. In other words, the table is tilted in the own store's favor — and the own store still comes last. Register shipping costs and the gap widens further.
Trap ② If you don't attach ad spend to channels, this whole report disappears
If you only track ad spend as “the total for this month,” comparing channels is impossible. At minimum, attribute it on a media → landing channel basis: in-platform ads go to that platform, and ads that drive traffic to your own store (search, social) go to the own store. For brand ads that span multiple channels, even starting by allocating them in proportion to each channel's revenue share is far better than doing nothing.
Trap ③ The own store's effective payment fee — it defied conventional wisdom
“The own store's payment fee isn't a single number. If the share of easy-pay methods is high, the effective fee rate is higher than you think” — it's a frequently quoted caveat. For this brand, it didn't hold.
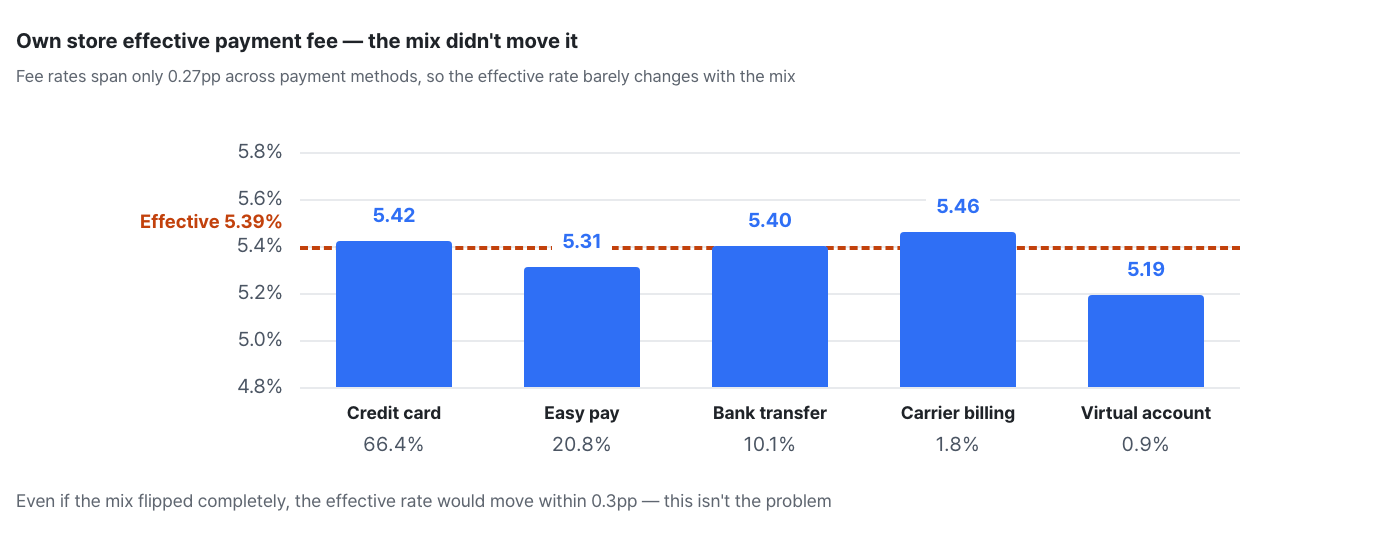
| Payment method | Payment share % | Fee rate % |
|---|---|---|
| Credit card | 66.4 | 5.42 |
| Easy pay | 20.8 | 5.31 |
| Bank transfer | 10.1 | 5.40 |
| Mobile carrier billing | 1.8 | 5.46 |
| Virtual account | 0.9 | 5.19 |
| Effective fee rate (weighted average) | 100.0 | 5.39 |
Payment mix wasn't this brand's problem
| Checkpoint | Standard | If it fails |
|---|---|---|
| Unified revenue basis | Net sales reflecting refunds & cancellations | You compare different numbers from the very first row |
| Ad account integration | All media → attributed to landing channel | Channel comparison becomes impossible |
| Seller-paid shipping costs | Registered per channel | The entire logistics layer drops out, tilting results in the own store's favor |
| Product ↔ COGS match rate | 95% or higher | Unmatched products are counted at zero COGS → margin overstated |
| Fee rate by payment method | Effective rate = mix-weighted average | Assumptions diverge from reality (though the gap may be small) |
Monthly · quarterly routine
| Cadence | What to do | Done when |
|---|---|---|
| W1 | Standardize the revenue basis on net sales and connect ad accounts for all media. Register seller-paid shipping costs | A channel table with all four cost layers filled in |
| W2 | In P & L Analysis › P&L by Channel, switch from revenue sort to net margin rate sort and record both rankings side by side | A list of channels that moved 3 or more places |
| W3 | Flag channels with a large gap between revenue share and margin contribution share. Separate candidates for budget increases from candidates for efficiency improvements | Proposed ad budget changes by channel |
| W4 | Validate channel roles in User Analysis › First Purchase / Repurchase. Explicitly label channels that can't be verified | Channel role definitions (including verification status) |
| Once a quarter | Review margin rate trends by channel for any step-down declines. Trace the cause: fee changes, falling ad efficiency, or rising refunds | Margin rate trend chart · notes on causes for outlier channels |
Summary
-
The revenue ranking and the margin rate ranking were nearly reversed — rank correlation -0.943. The No. 1 revenue channel had the lowest margin rate (14.6%), while the No. 5 revenue channel had the highest (67.2%).
-
What flips is the rate, not the amount. The correlation between the net margin amount ranking and the revenue ranking is 0.771 — the amount speaks to scale, the rate to efficiency. You need to look at both.
-
It was ad spend, not fees, that flipped the rankings. The own store had the cheapest fees (5.4%) but the most expensive ad spend (48.2%), leaving it with the lowest margin rate.
-
The own store generates only 49.0% of margin from 73.6% of revenue (-24.6pp). Every other channel contributes a larger share of margin than of revenue.
-
The room for promotions steering customers to the own store is 0%. Every gap is negative, so the first job isn't steering — it's fixing the own store's ad spend structure.
Minimum settings to reproduce this report with your own data
| Item | Value | Why |
|---|---|---|
| Revenue basis | Net sales reflecting refunds & cancellations, identical across all channels | If each channel uses a different basis, things go wrong from the first row |
| Cost layers | Sales & payment fees / logistics / advertising / COGS — all four | Miss even one and you get a fake net margin |
| Ad spend attribution | Media → landing channel (if that's hard, allocate by revenue share) | Without it, channel comparison is impossible |
| Net margin rate definition | 100 − fees − ad spend − COGS (channel net sales = 100) | Comparable regardless of channel size |
| Sort | Twice: by revenue, then by net margin rate | Whether the rankings flip is what this report is all about |
| Companion metric | Net margin amount ranking | Looking at rates alone overrates small channels |
| Role validation | First purchase / repurchase share by channel | Without validation, “acquisition channel” is just a label |
Frequently asked questions
Q. How do I calculate net margin by channel?
Start from channel net sales (reflecting refunds and cancellations) and subtract, in order, sales and payment fees, logistics and fulfillment costs, channel-attributed ad spend, and product COGS. The key is less the calculation itself than bringing numbers scattered across four places into one table.
Q. How do I fairly compare marketplace fees with own-store fees?
Because what's included in “fees” differs by channel, you need to unpack all four layers and rebuild them on a common basis. When we did that for this sample, the channel with the cheapest fees actually had the lowest margin rate — because the missing layer (ad spend) was bigger than the fees.
Q. Should I put more ad budget into my No. 1 revenue channel?
Decide based on net margin rate × growth headroom, not revenue rank. Channels with high margin rates but a small share of revenue are the top priority for increases; for channels with big revenue but thin margins, improving ad efficiency must come first.
Q. Should I pull out of channels with thin margins?
Not necessarily. A channel that brings in many new customers can be assigned the role of an acquisition channel. However, you need to confirm that the customers it brings in actually repurchase. If, as in this sample, customers on marketplace channels can't be identified, validation is simply impossible — and it's more honest to state that explicitly.
Q. What percentage can I spend on own-store-only reward points?
The ceiling is the margin rate gap between your own store and the other channel. There's only room when the gap is positive. In this sample, every gap was negative (-49.9pp to -38.5pp), so the room was 0%. Don't go by gut feeling — check this number first.
The figures in this report are not real transaction data. They are illustrative values generated to reflect the distribution of Laplace benchmark metrics. They do not represent any specific customer, so please use them to understand trends rather than as absolute values. Figures from public research cite their sources in each item. Screen and setting names may differ slightly depending on the release.