Settlement Says 72.5, the Bank Keeps 21.1 — Breaking Down Fulfillment Channel P&L
If GMV is 100, the number on your settlement dashboard is 72.5. What you actually keep is 21.1. The 51.4 in between isn'
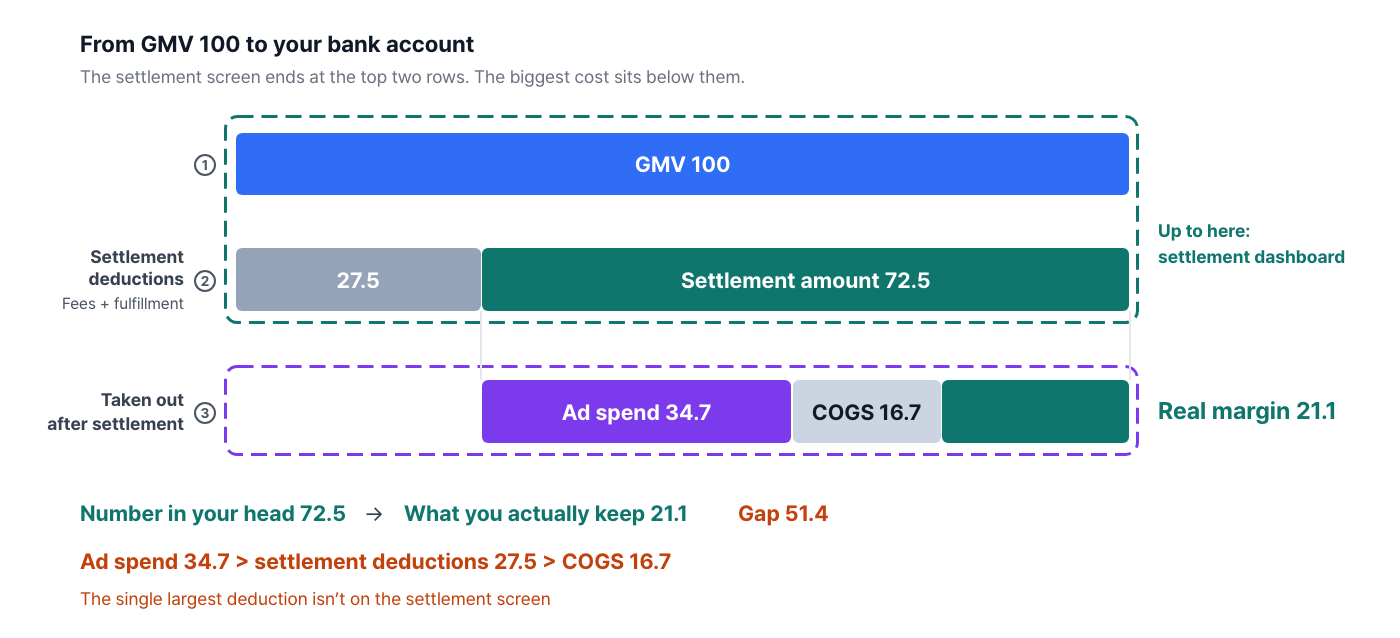
If GMV is 100, the number on your settlement dashboard is 72.5. What you actually keep is 21.1. The 51.4 in between isn't an error — it's ad spend (34.7) and COGS (16.7), billed outside the settlement screen. For this brand, the single largest deduction was ad spend — bigger than the settlement deductions (27.5).
Sample data from a commerce brand · 12 months · about 110,000 fulfillment-channel orders / about 96,000 buyers / 26 SKUs. Each section also lists the Laplace screen and settings where you'll find that number.
The figures in this report are not real transaction data; they are sample values generated to reflect the distribution of Laplace benchmark metrics. They are not any specific customer's actual numbers — please use them to understand trends, not as absolute values.
PART 01 · First — which screens to open
You don't need the whole menu. These are only the screens that produce the numbers in this report.
| Menu | Screen | Which number in this report | Priority |
|---|---|---|---|
| Data Management | Channel & Ad Account Integration | The prerequisite for putting GMV, fees and ad spend on one screen | Priority 1 |
| Data Management | Base Product & COGS Registration | The input for real margin at the SKU level | Priority 1 |
| P & L Analysis | P&L by Channel | Compare margin rates by channel on a net-payout basis | Priority 1 |
| Product Analysis | Analysis by Product | Ad spend and real margin by SKU (list of loss-making SKUs) | Priority 1 |
| Ad Analysis | By ad channel · By campaign | Actual ROAS by SKU | Priority 2 |
| Custom Dashboard | Monthly cost-ratio trend chart | A month where the fee or ad-spend ratio spikes = early warning | Priority 2 |
| Custom Alarms | Metric spike alerts | Automatic detection of sudden jumps in the ad-spend ratio | Priority 3 |
The hard part isn't the math — it's pulling the data together
PART 02 · A quick self-check — if you'd answer “I don't know” to any of these four
-
Do you know what % of GMV went to ad spend on this channel last month?
-
Have you ever broken down the deductions on your settlement statement into sales fees / fulfillment / other?
-
Of the SKUs you sell on this channel, do you know how many lose money once ad spend is included?
-
Can you put a number on the gap in net-payout margin rate between this channel and your own store?
If these are hard to answer, it isn't the operator's fault. You've simply never combined the numbers, so you don't know the combined figure.
Costs fall into three buckets
| Type | Item | Where it shows up |
|---|---|---|
| ① Settlement deduction | Sales fees (vary by category) | Deducted on the settlement statement — reflected in the dashboard settlement amount |
| ② Settlement deduction | Fulfillment costs — inbound/outbound, delivery, storage (rising with long-term storage) | Deducted on the settlement statement — mostly reflected |
| ③ Billed separately | Ad spend | Paid separately from settlement — not in the dashboard settlement amount |
On top of this come variable items such as return and pickup costs or promotion cost-sharing, depending on the period. The heart of the problem is ③. On a fulfillment channel, running ads is practically mandatory to get visibility and sales, yet that cost is completely separated from the settlement flow. It's the cost that generated the revenue, but it doesn't sit next to the revenue.
This article contains no industry benchmarks
Next screen — now we know the structure. Let's see how much actually leaks out at each step.
PART 03 · Priority 1 — where does 100 of GMV go?
Brand C is a Korean beauty brand selling consumables — repeat-purchase items such as essences, cleansers and body care. About a third of its revenue comes from a major platform's fulfillment channel.
Before you read the numbers
Where to look in Laplace — P & L Analysis › P&L by Channel
How to set it up
-
Finish Channel & Ad Account Integration first. Without the ad accounts connected, this report's conclusion (ad spend is the largest deduction) simply won't show up.
-
Register COGS on your base products. Without COGS, you can only calculate net payout, not real margin.
-
Set the date range to 12 months, so that a single month of seasonal promotions doesn't skew the ratios.
-
Turn on all four measures: GMV · Fees · Ad Spend · COGS. Putting those four in one table is what this whole report is about.
| Settlement amount (what the dashboard shows) | Ad spend (not in the settlement amount) | COGS | Real margin (what you actually keep) |
|---|---|---|---|
| 72.5 | 34.7 | 16.7 | 21.1 |
How to read the numbers
-
The single largest deduction is ad spend. Ad spend 34.7 > settlement deductions 27.5 > COGS 16.7. Ad spend exceeds sales fees and fulfillment combined. Yet this largest cost doesn't appear on the settlement screen.
-
The number in your head and the number in your bank account are 51.4 apart. Plan your cash flow off the 72.5 settlement amount and you'll be off by that much every month.
-
As GMV grows, ad spend grows with it. That's why GMV growth isn't the same as profit growth — PART 06 shows exactly how the two diverged for this brand.
Next screen — we've seen this channel's structure. But how does it look compared with other channels? This is where conventional wisdom gets flipped.
PART 04 · Conventional wisdom, reversed — the low-fee channel didn't keep more
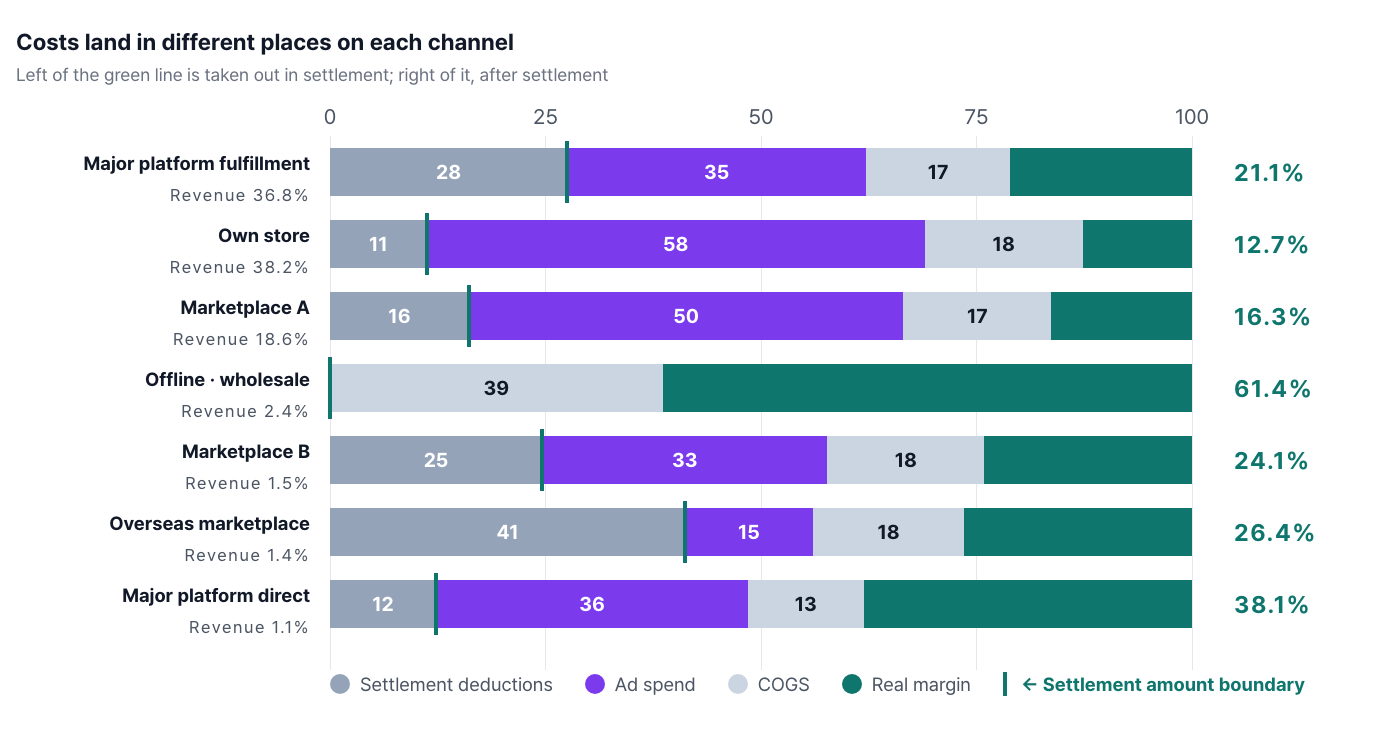
“Your own store only takes a few % in payment fees, while a fulfillment channel stacks up sales fees, fulfillment and ads.” That's true. But on a net-payout basis, the conclusion came out the other way.
Where to look in Laplace — P & L Analysis › P&L by Channel
| Channel | Revenue share % | Settlement deductions (fees + fulfillment) | Ad spend (billed separately) | COGS | Settlement amount (dashboard) | Real margin |
|---|---|---|---|---|---|---|
| Major platform fulfillment | 36.8 | 27.5 | 34.7 | 16.7 | 72.5 | 21.1 |
| Own store | 38.2 | 11.2 | 57.8 | 18.3 | 88.8 | 12.7 |
| Marketplace A | 18.6 | 16.1 | 50.4 | 17.2 | 83.9 | 16.3 |
| Offline · Wholesale | 2.4 | 0.0 | 0.0 | 38.6 | 100.0 | 61.4 |
| Marketplace B | 1.5 | 24.6 | 33.1 | 18.2 | 75.4 | 24.1 |
| Overseas marketplace | 1.4 | 41.2 | 14.8 | 17.6 | 58.8 | 26.4 |
| Major platform direct shipping | 1.1 | 12.3 | 36.2 | 13.4 | 87.7 | 38.1 |
How to read the numbers
-
Settlement deductions on the own store are 2.5x lower — 11.2 vs 27.5. But ad spend is 1.67x higher (57.8 vs 34.7), so real margin comes to just 12.7, 0.60x that of the fulfillment channel (21.1).
-
A low-fee channel has to buy its own traffic. The fee a platform takes is partly the “price of traffic.” Your own store pays that price as ad spend instead of fees — and for this brand, the ad spend route was the more expensive one.
-
Channels that don't run ads have overwhelming margins. Offline · wholesale has no settlement deductions and no ad spend, so its real margin is 61.4. But its revenue share is only 2.4% — the channels with high margin rates are not the channels that build scale.
-
The overseas marketplace has the heaviest settlement deductions at 41.2, but its ad spend is light at 14.8, leaving a real margin of 26.4. That's why you shouldn't judge a channel by its fee rate alone.
This doesn't mean you should shut down your own store
Next screen — we've seen the channel averages. But even within the same channel, every product is different.
PART 05 · Break it down by SKU and the loss-making products surface
Where to look in Laplace — Product Analysis › Analysis by Product
| Product | Revenue share % | Settlement deductions (fees + fulfillment) | Ad spend (billed separately) | COGS | Settlement amount (dashboard) | Real margin |
|---|---|---|---|---|---|---|
| Hydrating Essence 10-pack | 21.8 | 28.4 | 29.8 | 17.1 | 71.6 | 24.7 |
| Soothing Essence 10-pack | 12.3 | 24.6 | 43.2 | 18.0 | 75.4 | 14.2 |
| Cleansing Oil 500ml | 10.9 | 28.5 | 33.3 | 12.7 | 71.5 | 25.5 |
| Cleansing Oil 250ml | 9.5 | 28.1 | 36.5 | 12.7 | 71.9 | 22.7 |
| Hydrating Essence 5-pack | 7.5 | 29.0 | 26.3 | 19.2 | 71.0 | 25.5 |
| Body Lotion 400ml | 7.2 | 27.7 | 33.9 | 11.3 | 72.3 | 27.1 |
| Lip Balm Set | 5.5 | 26.3 | 29.8 | 25.4 | 73.7 | 18.5 |
| Soothing Essence 5-pack | 5.1 | 27.6 | 35.0 | 17.4 | 72.4 | 20.0 |
| Hand Cream 3-Piece Set | 4.9 | 25.1 | 55.4 | 23.6 | 74.9 | -4.1 |
| Cleansing Oil 150ml | 3.8 | 29.3 | 27.7 | 13.5 | 70.7 | 29.5 |
| Body Lotion 200ml | 3.6 | 26.4 | 30.6 | 10.1 | 73.6 | 32.9 |
| Lip Balm (single) | 3.3 | 25.9 | 34.8 | 23.6 | 74.1 | 15.7 |
| Tone-Up Base 50ml | 3.0 | 29.0 | 43.2 | 18.8 | 71.0 | 9.0 |
| Tone-Up Base 30ml | 1.5 | 29.0 | 41.4 | 18.0 | 71.0 | 11.6 |
| Spread in settlement deductions | Spread in ad spend | Real margin range | SKUs with negative real margin |
|---|---|---|---|
| 4.7pp | 29.1pp | -4.1–32.9 | 3/26 |
How to read the numbers
-
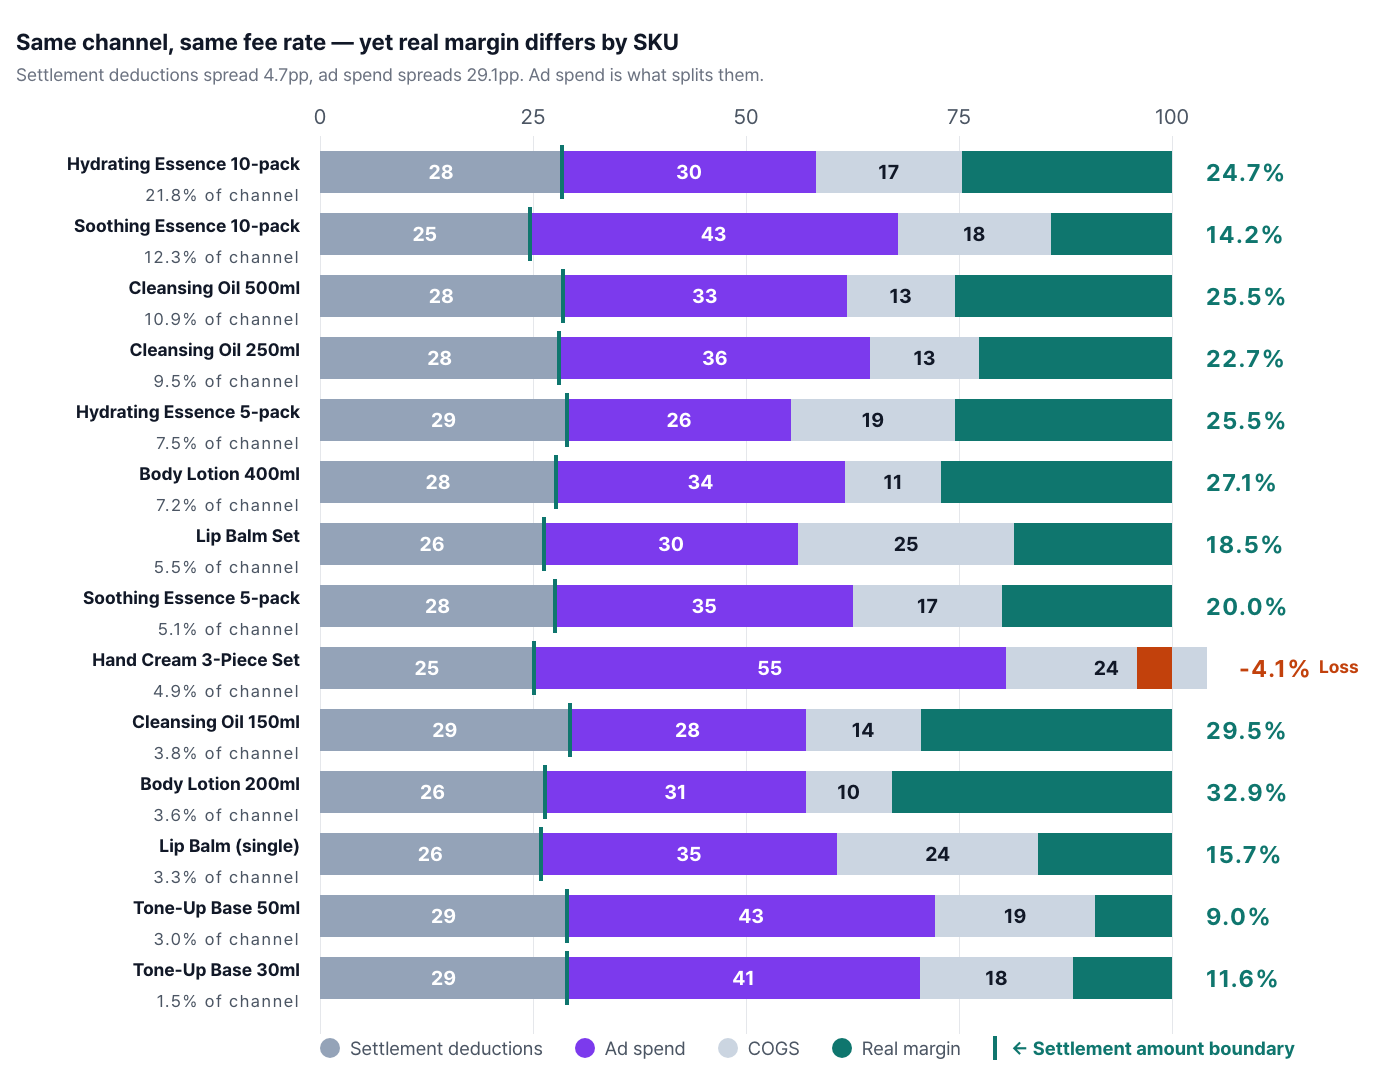
What makes the difference is ad spend, not fees. Within the same channel, settlement deductions are nearly uniform at 24.6–29.3 (a 4.7pp spread), while ad spend ranges widely from 26.3 to 55.4 (a 29.1pp spread).
-
The “Hand Cream 3-Piece Set” loses more the more it sells. Subtract 55.4 in ad spend and 23.6 in COGS and the real margin is -4.1. With a 4.9% share of channel revenue, it's not small, so it takes a visible bite out of overall margin.
-
You'll never see it in monthly totals. For the channel as a whole, the real margin is 21.1 — profitable. Only when you break it down does it become clear that 3 of the 26 SKUs are losing money.
Use break-even ROAS as your decision line
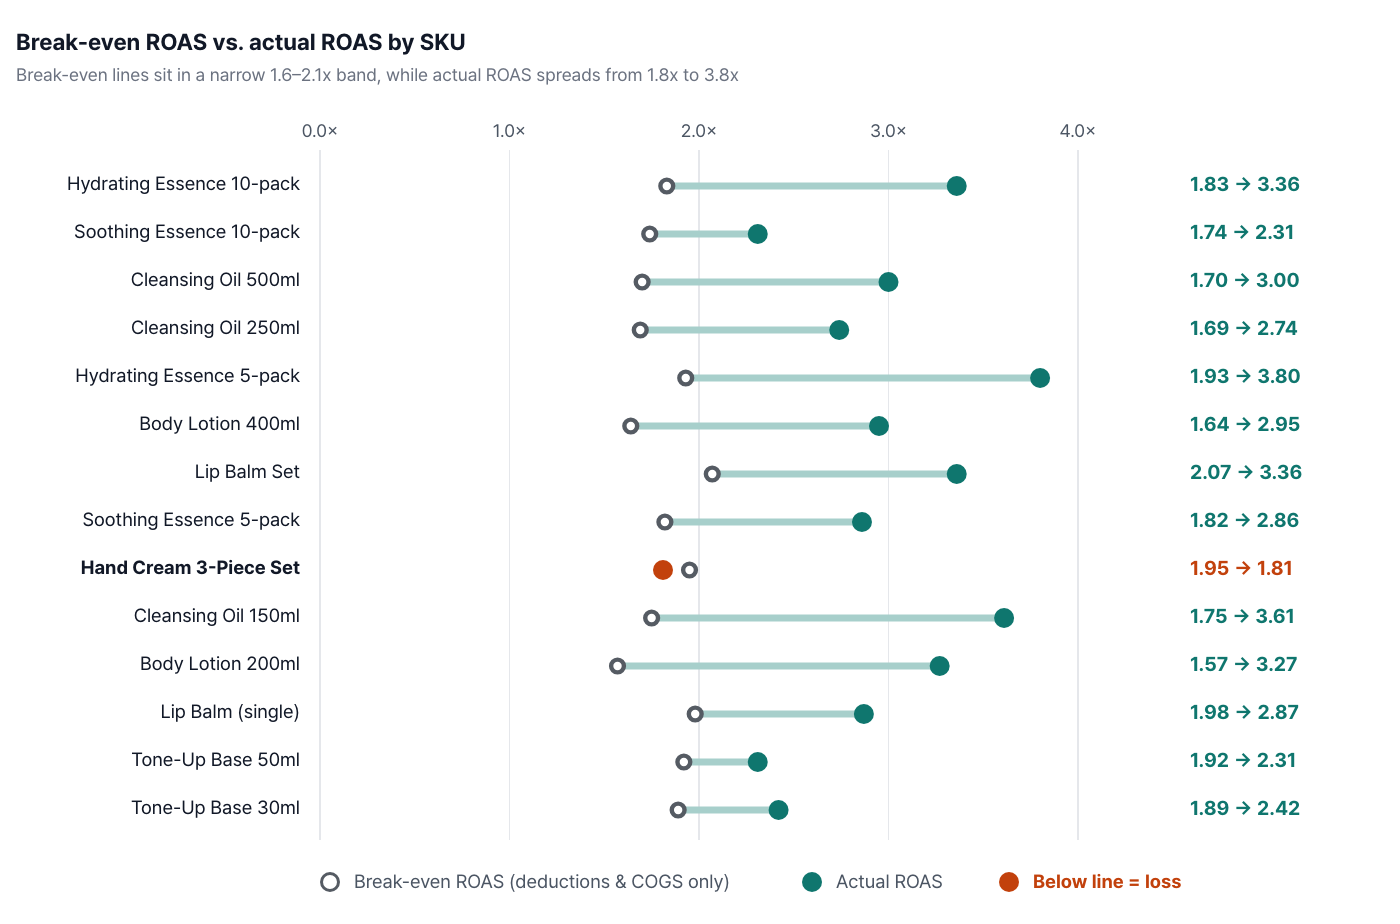
Break-even ROAS = 100 ÷ (100 − settlement deductions − COGS)
-
Break-even lines sit in a narrow band of 1.57–2.07x. Within one channel the fees are the same and only the COGS ratio differs. With a range this tight, setting a single channel-wide target is reasonable — just note that the higher a product's COGS ratio, the higher its threshold.
-
Actual ROAS spreads widely, from 1.81x to 3.80x. Narrow thresholds, wide results — that gap is your room to rebalance ad budget by SKU.
-
The SKUs that fall short of their threshold are exactly the loss-making SKUs. They're the candidates for cutting ads, adjusting prices or pulling from this channel.
Next screen — we now have a decision rule for each product. Next: how soon you notice when something goes wrong.
PART 06 · On the settlement screen alone, nothing seems to be happening
Where to look in Laplace — Custom Dashboard › Monthly cost-ratio trend chart
How to read the numbers
-
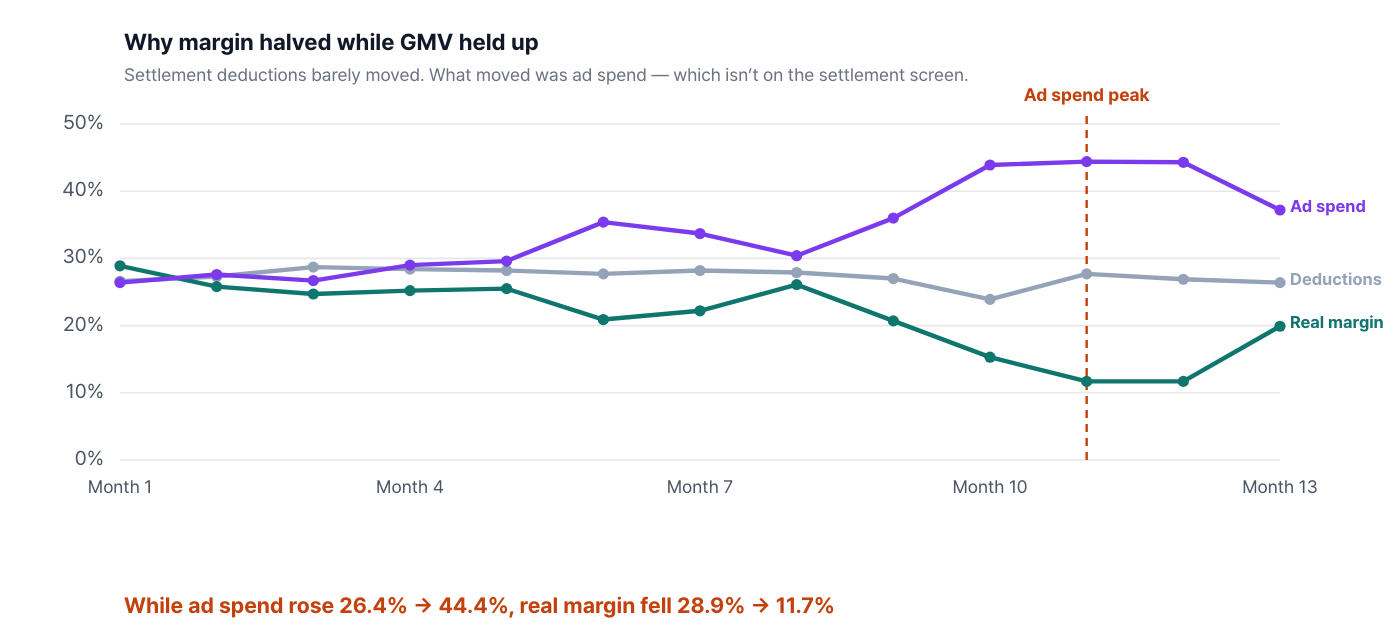
Settlement deductions are nearly fixed at 23.9–28.7. Naturally — they're contractual fee rates. Looking only at settlement statements, nothing happened for 13 straight months.
-
Over the same period, ad spend rose from 26.4 to 44.4. As a result, real margin fell from 28.9 to 11.7 — cut to roughly a third.
-
Meanwhile, GMV actually went up. The mystery of “sales are growing, so why does the bank balance look like this?” is exactly this chart. If you only watch GMV, you won't find out until the very end.
-
A month where a ratio spikes always has a cause. Long-term storage fees kicking in (a sign of overstock), a surge in returns (a product or detail-page problem), falling ad efficiency — checking settlement consistency is operational anomaly detection.
Next screen — every number so far rests on the assumption that costs are classified correctly. In practice, there are three places where they aren't.
PART 07 · Pitfalls — skip these three checks and the tables above are wrong
Pitfall ① Sales fees and fulfillment arrive as one lump
In this brand's data, sales fees and fulfillment costs came in merged into a single “fees” item. That's why this report treats them only as one “settlement deductions” column. To answer self-check question two (“Have you broken them down into sales fees / fulfillment / other?”), you need to upload the original settlement statements separately. If you don't split them, you'll miss signals like a spike in storage fees.
Pitfall ② If ad spend isn't attached to products, PART 05 disappears entirely
If you only manage ad spend as “X total this month,” you'll never know which products are eating it. You need to allocate ad spend to SKUs through campaign–product mapping to get the list of loss-making SKUs. It doesn't have to be perfect — if mapping is hard, even starting with allocation by each product's revenue share is enough to expose the gaps.
Read the ratios without knowing the allocation rule, and you'll be wrong in the opposite direction
Pitfall ③ Zero ad spend on a channel or product doesn't mean “high efficiency”
Channels recorded with zero ad spend, such as offline · wholesale, look overwhelmingly profitable with a real margin of 61.4. But that means you don't advertise on that channel, not that it's efficient. Your brand awareness may well have been built by ad spend on other channels. Take zero-ad-spend items out of the margin-rate ranking and look at them separately.
| Check item | Standard | If it falls short |
|---|---|---|
| Ad account integration | All media connected | The largest deduction drops out of the table entirely |
| Product ↔ COGS match rate | 95% or higher | Unmatched products are counted at zero COGS → real margin overstated |
| Ad ↔ product match rate | 95% or higher | No per-SKU list of loss-makers |
| Settlement statement upload | Once a month | Can't separate sales fees from fulfillment |
| Ratio-based view | % of GMV, not amounts | Anomaly signals get masked by changes in scale |
Three monthly and quarterly routines
| Cadence | What to do | Definition of done |
|---|---|---|
| 30 minutes at the start of each month | Calculate last month's settlement deductions, ad spend and COGS as ratios of GMV and compare with the prior month. Find the cause of any item that spikes | Month-over-month change table for the three ratios · notes on the cause of any anomaly |
| Monthly | Allocate ad spend to SKUs and update the real-margin table by SKU. The bottom-ranked products are that month's decision items | List of loss-making SKUs · decision to cut ads / adjust price / pull from channel |
| Once a quarter | Re-evaluate the channel portfolio using net-payout margin rates. Separate growth channels from profit channels and define their roles | Channel role definitions · ad budget allocation criteria |
Summary
-
Settlement amount 72.5, real margin 21.1. The 51.4 in between isn't an error — it's structural.
-
The single largest deduction was ad spend — 34.7 > settlement deductions 27.5 > COGS 16.7. The biggest cost isn't on the settlement screen.
-
The low-fee channel doesn't necessarily keep more. The own store's settlement deductions were 2.5x lower, but its ad spend was 1.67x higher, so its real margin was 0.60x.
-
Losses only show when you break things down. The channel as a whole was profitable, yet 3 of 26 SKUs were losing money. The dividing line isn't fees (a 4.7pp spread) but ad spend (a 29.1pp spread).
-
The settlement screen gives no early warning. While settlement deductions held steady at 23.9–28.7, ad spend climbed 26.4→44.4 and margin fell 28.9→11.7.
Minimum setup to reproduce this report with your own data
| Item | Value | Why |
|---|---|---|
| Prerequisites | Channel integration + ad account integration + COGS registration | Miss any one of the three and the conclusion disappears |
| Measures | GMV · Fees · Ad Spend · COGS together | Putting the four in one table is what this report is about |
| Date range | 12 months (13 months for the monthly trend) | So one month of seasonal promotions doesn't skew the ratios |
| Real margin definition | GMV − settlement deductions − ad spend − COGS | The settlement amount is before ad spend |
| Break-even ROAS | 100 ÷ (100 − settlement deductions − COGS) | Each SKU has a different COGS ratio, so each has a different threshold |
| Breakdown axes | Channel → SKU → Month | Narrowing in this order leaves you with a single cause |
| Display basis | % of GMV, not amounts | Comparisons hold even as scale changes |
Frequently asked questions
Q. Why is the expected settlement amount different from what actually lands in my account?
Sales fees and fulfillment costs are deducted in settlement and reflected in the dashboard settlement amount, but ad spend is billed separately from settlement. If ad spend is 34.7% of GMV, as with this brand, the gap between the settlement amount and the money you actually keep widens by that much.
Q. What fee percentage is normal?
Sales fee rates and fulfillment charges vary by category, product size and contract terms. More important than other people's averages is calculating your own brand's ratios for last month. And as this report shows, what needs managing is usually ad spend, not fees.
Q. Which is more profitable: a fulfillment channel or our own store?
Compare them on net-payout margin rate, not revenue. In this sample, the fulfillment channel came in at 21.1 and the own store at 12.7 — the channel with the higher fees kept more. That said, even with a thin margin, a channel that holds your customer data can be given a different role.
Q. How do I split ad spend by SKU?
Campaign–product mapping is the standard approach; if that's difficult, you can start by allocating by each product's revenue share. Only once it's allocated does the list of “products sold at a loss by burning ad spend” emerge. Just remember that reading ratios without knowing the allocation rule leads you wrong in the opposite direction (PART 07, Pitfall ②).
Q. Can't we just cut ad spend?
On this kind of channel, cutting ads cuts GMV too. So rather than the total, start by cutting the SKUs that fall short of their break-even ROAS. In this sample, the thresholds were 1.57–2.07x, and the SKUs that fell short were exactly the loss-making SKUs.
The figures in this report are not real transaction data; they are sample values generated to reflect the distribution of Laplace benchmark metrics. They are not any specific customer's actual numbers — please use them to understand trends, not as absolute values. Figures from public research are cited at each item. Screen and setting names may differ slightly depending on the release.