Why “How much did we sell today?” has two answers — the gap between same-day sales and confirmed sales
If orders come in at 100, only 91.03 ends up confirmed. The real problem isn't the size of the gap — it's the timing. Th
If orders come in at 100, only 91.03 ends up confirmed. The real problem isn't the size of the gap — it's the timing. The number your dashboard shows on the day reflects just 45.5% of the final gap; more than half of it gets shaved off over the following days.
Public research data + sample data from a commerce brand · 11 months · approx. 310,000 orders / approx. 260,000 purchasers / approx. 24,000 claims. For each part, we also note the Laplace screen and settings where you can see that number.
The figures in this report are not real transaction data. They are illustrative values generated to reflect the distribution of Laplace benchmark metrics. They do not represent any specific customer, so please use them to understand trends rather than as absolute values.
PART 01 · First — which screen to open
You don't need to go through every menu. We've picked only the screens that produce the numbers in this report.
| Menu | Screen | Which number in this report | Priority |
|---|---|---|---|
| Custom Dashboard | Sales Gap Chart (you build it yourself) | Same-day close sales and confirmed sales side by side | Priority 1 |
| Data Management | Connected Channels | Find channels whose claims aren't coming in — this is the prerequisite | Priority 1 |
| Product Analysis | By Product | Gap by product (0%–50%) | Priority 1 |
| Order Analysis | Cancellations · Refunds | Claim counts and amounts, breakdown by reason | Priority 2 |
| Ad Analysis | By ad channel · By campaign | ROAS recalculated on a confirmed basis | Priority 2 |
| P & L Analysis | Margin Rate / Contribution Margin Rate | Confirmed-basis P&L — real profit with the gap reflected | Priority 2 |
| Custom Alerts | Metric spike alerts | Automatically detect days when the gap ratio jumps | Priority 3 |
You only need to build one new thing
PART 02 · Cancellations and refunds aren't accidents, they're statistics — what research has confirmed
Before looking at our own data, let's set a baseline. How common returns are has already been measured at scale.
| Study | Confirmed figures |
|---|---|
| NRF & Happy Returns, 2025 Retail Returns Landscape | Average return rate for online orders: 19.3% (15.8% for total retail including offline). Online runs 2–3x higher than offline |
| NRF · Radial · Capital One Shopping (2025–2026) | The spread across categories is even wider — apparel 20–30% (footwear 31.4%), electronics and small appliances 8–15%, beauty 4–12% |
| Claimlane, Why Customers Return Products (2026) | The No. 1 reason for returns is size/fit mismatch at about 45%; No. 2 is “not as described or pictured” at about 22% |
| Statista · Capital One Shopping (2025) | 6 in 10 consumers say they practice bracketing — ordering several sizes at once and returning the ones that don't fit |
| True Fit (2025) | A case where introducing size recommendations reduced bracketing by 24% |
In short, cancellations and refunds aren't exceptions — they're a structural cost. The goal isn't to “bring the gap to zero” but to “know the gap and factor it into decisions.”
So far, these are other people's numbers
Next screen — research only goes as far as “returns are common.” What it doesn't tell you is when that gap shows up on your dashboard.
PART 03 · Priority 1 — How 100 in orders becomes 91.03 confirmed
Brand B is a Korean home-beauty device brand. Its own store accounts for about 80% of sales, and it also runs an overseas own store, large platforms and open marketplaces. As a small-appliance category, it falls in the 8–15% return-rate band of the benchmarks.
Before you read the numbers
Where to see it in Laplace — Custom Dashboard › Add Chart › Sales Trend
How to set it up
-
Turn on “Same-day Sales” and “Confirmed Sales” as measures together. With only one turned on, you won't see this report's conclusion.
-
Set the date range to 11 months or more, so that a single seasonal promotion doesn't skew the average gap.
-
Cut off the most recent 2 weeks. Cancellations and refunds haven't fully landed in that window yet — see PART 04 for why.
-
Set the aggregation unit to Day and save. At a monthly level, the lag pattern in the next part gets blurred.
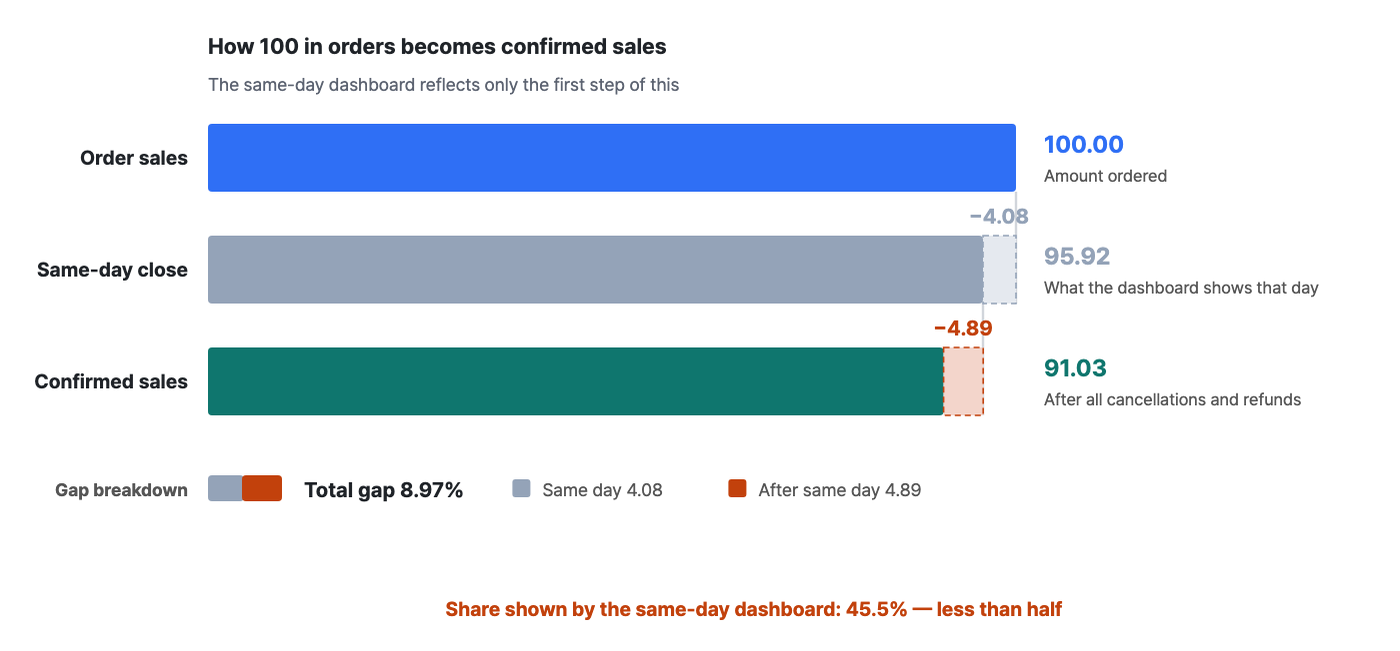
| Total gap (orders → confirmed) | Cancelled within the same day (a) | Cancelled/refunded after the same day (b) | Share shown by the same-day dashboard |
|---|---|---|---|
| 8.97% | 4.08pp | 4.89pp | 45.5% |
How to read the numbers
-
The total gap is 8.97%. That sits within the benchmark's “typically 5–15%” range, and is consistent with the 8–15% count-based return rate for the small-appliance category.
-
But more than half of the gap is invisible on the day. The 4.08pp cancelled within the same day is reflected in that day's numbers, but the 4.89pp is shaved off afterwards. The same-day dashboard captures just 45.5% of the gap.
-
So it's not that “same-day sales are wrong.” Same-day sales are unfinished. For spotting trends, they're the right number; for performance reviews, budgeting or purchase orders, they're inflated by 8.97%.
Next screen — we now know more than half gets shaved off later. So how many days do you have to wait before you can trust the number?
PART 04 · Confirmation lags — don't read the last few days
Where to see it in Laplace — Custom Dashboard › Sales Gap Chart
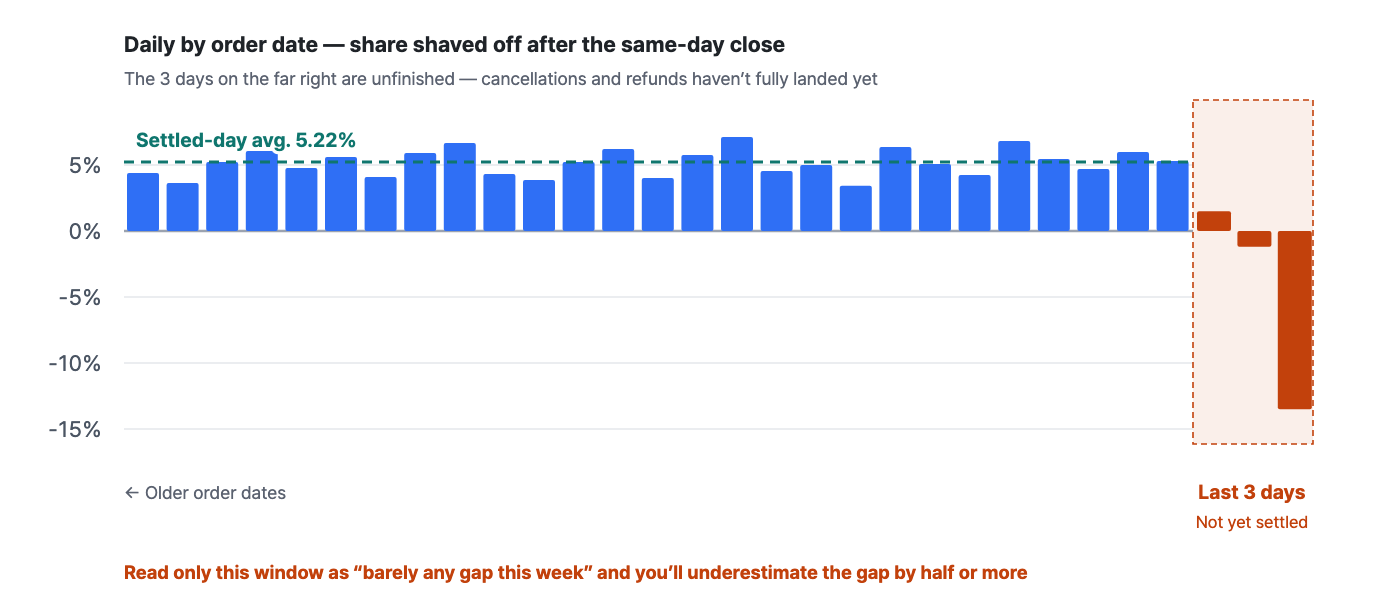
This is where people most often go wrong in this report
How to read the numbers
-
The settled-day average is 5.22% (vs. the same-day close). The range is 3.42–7.19%, so daily values vary by more than 2x. Never judge from a single day.
-
The average for the last 3 days is -4.40%. If you include this window when calculating “this week's gap,” you will underestimate the gap by half or more.
-
So calculate the gap ratio only over periods where confirmation has fully landed. For this brand, cutting off the most recent 2 weeks is safe. It differs by brand, so draw the chart above and find for yourself where the values start to stabilize.
Next screen — we've settled when to look. Now let's find where the gap sits.
PART 05 · The gap sticks to products, not dates
We started by testing the common belief that “the gap is bigger on promotion days.” On the date axis, there was no difference. The total gap was 8.6% on sales-spike days and 9.0% on normal days — if anything, spike days were slightly lower.
What actually split the gap was the product.
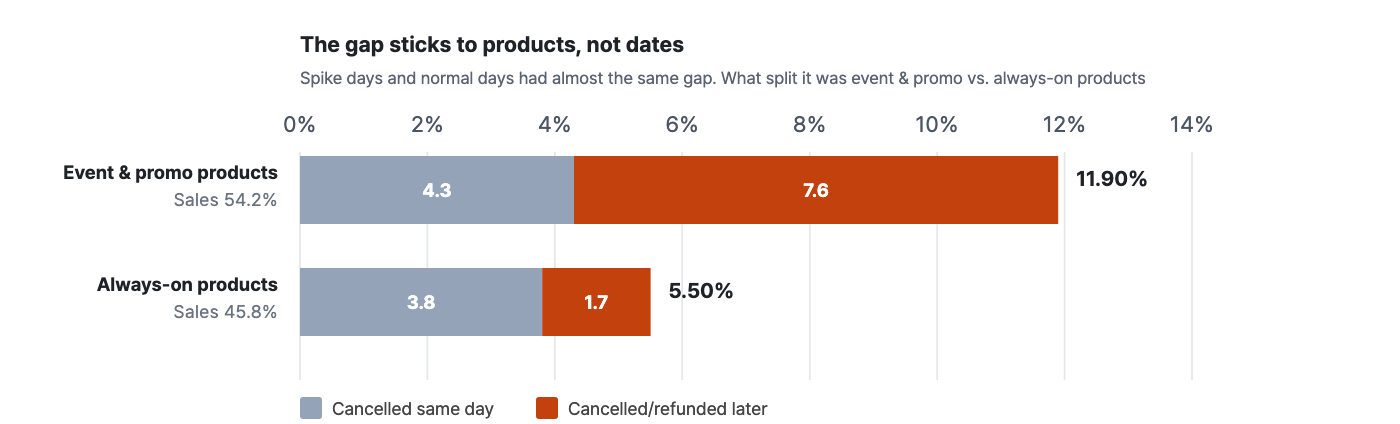
| Segment | Share of sales % | Cancelled within the same day (a) | Cancelled/refunded after the same day (b) | Total gap a+b | Same-day capture rate |
|---|---|---|---|---|---|
| Event & promo products | 54.2 | 4.30 | 7.60 | 11.90 | 36% |
| Always-on products | 45.8 | 3.82 | 1.68 | 5.50 | 69% |
Where to see it in Laplace — Product Analysis › By Product
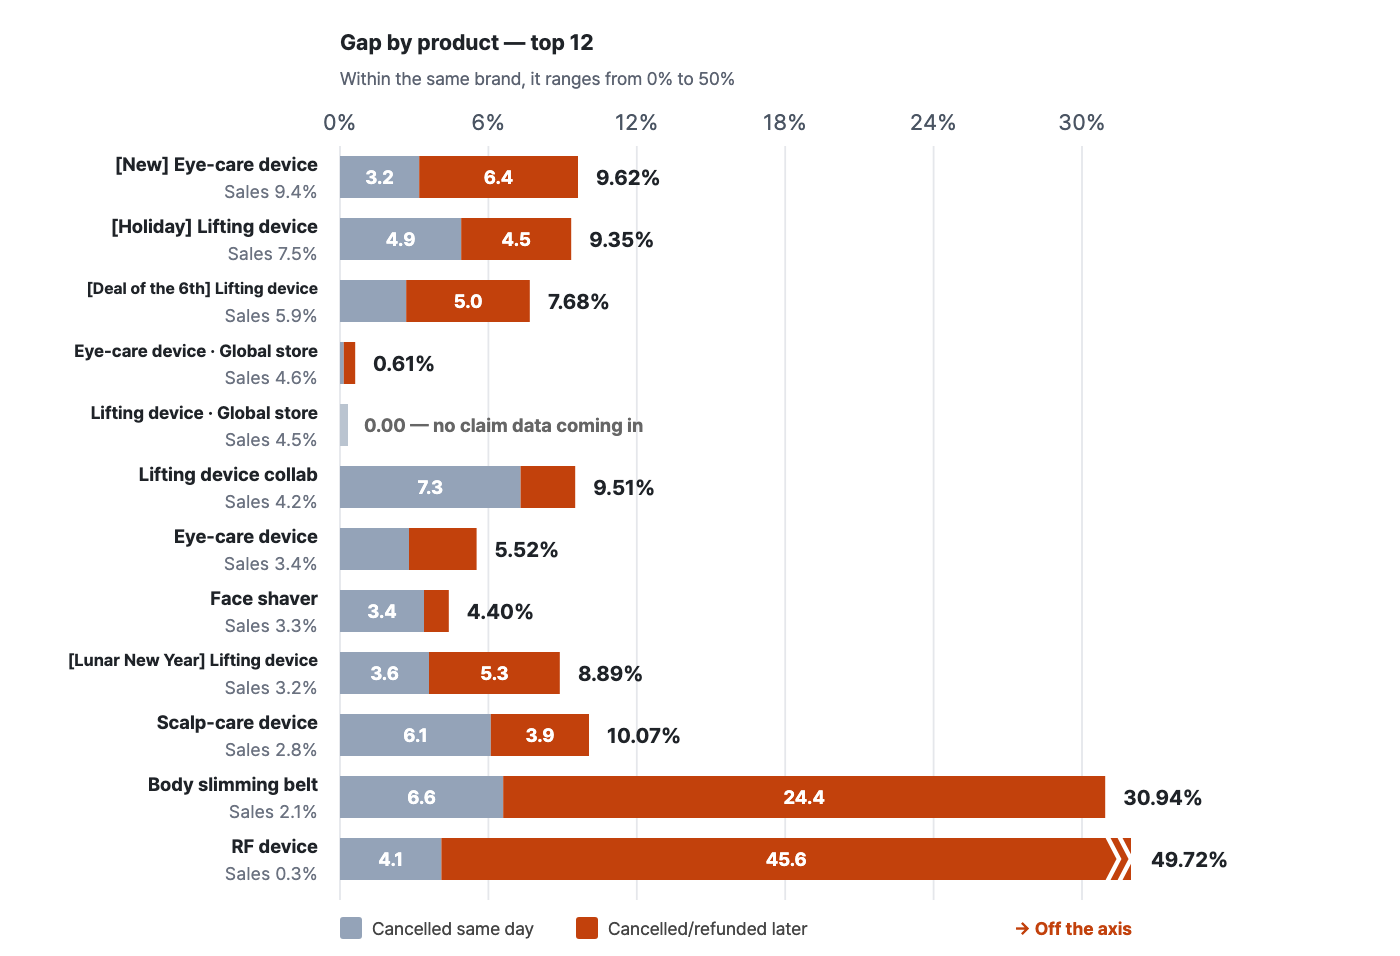
How to read the numbers
-
The gap for event and promo products is 2.16x that of always-on products — 11.9% vs 5.5%. The common belief that urgency-driven selling boosts impulse buying, and impulse buying comes back as cancellations, holds true — on the product axis, not the date axis.
-
Almost all of the difference is in segment b. The share cancelled within the same day (a) is similar at 4.30% vs 3.82%, but after the same day (b) it splits to 7.6% vs 1.68%. Evaluating promo campaigns on the day is where you'll be most wrong.
-
A single product can create a gap all on its own. The “RF device” has a total gap of 49.72%; it accounts for only 0.3% of sales, yet single-handedly drives a large part of the gap. In a category without size or fit issues, a gap this large is a signal to scrutinize the product detail page and how expectations are set.
-
Across the 61 products with at least 0.2% of sales, the gap ranges from a minimum of 0.0% · median of 6.9% · maximum of 38.6%. A single brand average of 8.97% doesn't let you act on anything.
Next screen — we've found the products. But even for the same product, the gap changes again depending on where it was sold.
PART 06 · Narrow down the cause by channel · day of week · payment method
Where to see it in Laplace — Custom Dashboard › Sales Gap Chart → Filters
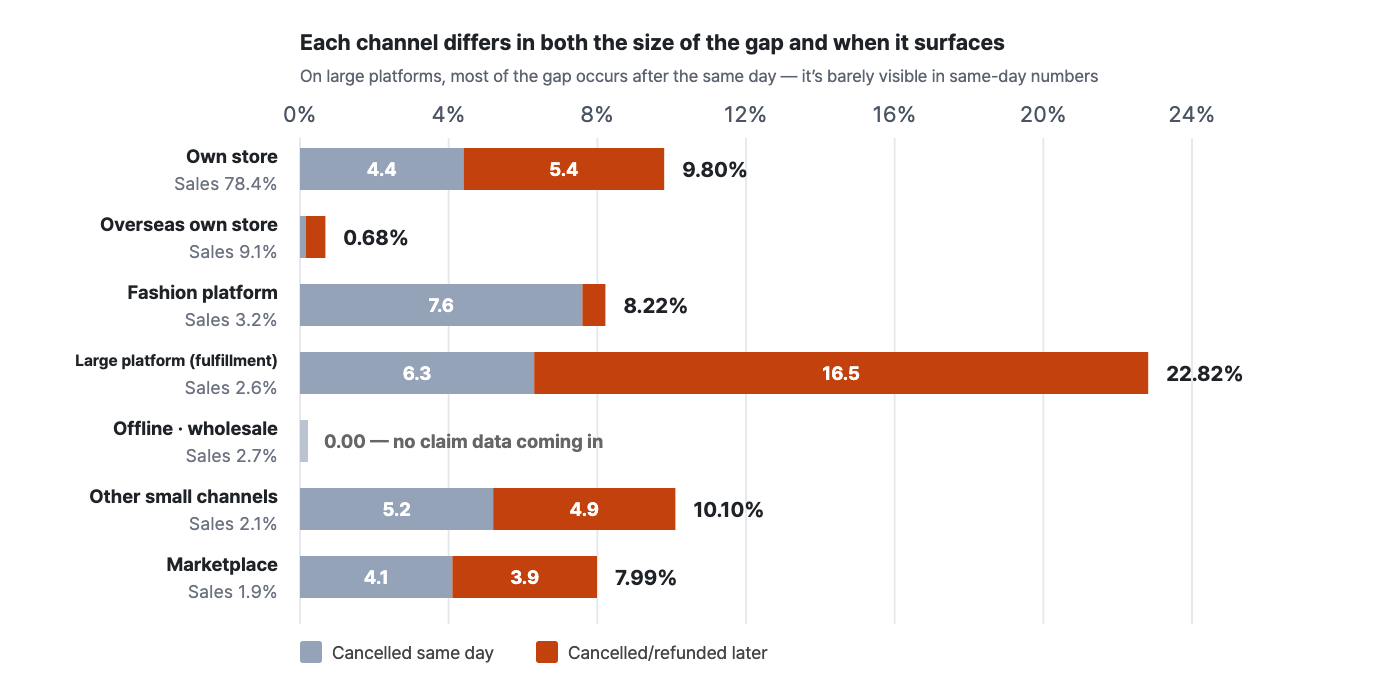
| Segment | Share of sales % | Cancelled within the same day (a) | Cancelled/refunded after the same day (b) | Total gap a+b | Same-day capture rate |
|---|---|---|---|---|---|
| Own store | 78.4 | 4.42 | 5.38 | 9.80 | 45% |
| Overseas own store | 9.1 | 0.16 | 0.52 | 0.68 | 24% |
| Fashion platform | 3.2 | 7.61 | 0.61 | 8.22 | 93% |
| Large platform (fulfillment) | 2.6 | 6.35 | 16.47 | 22.82 | 28% |
| Offline · wholesale | 2.7 | 0.00 | 0.00 | 0.00 | — |
| Other small channels | 2.1 | 5.20 | 4.90 | 10.10 | 51% |
| Marketplace | 1.9 | 4.13 | 3.86 | 7.99 | 52% |
How to read the numbers
-
The total gap on the large platform (fulfillment) is 22.82% — 2.3x that of the own store (9.80%). On top of that, its same-day capture rate is only 28%, so it's almost invisible in same-day numbers. On fulfillment channels, return intake and processing happen on the platform side, so they're reflected late.
-
The fashion platform is the exact opposite. Of its 8.22% total gap, 93% is captured on the same day — cancellations cluster on the order date itself. Channels differ not only in the size of the gap, but in when it surfaces.
-
The own store, which accounts for about 80% of sales, determines the overall gap. Its 9.80% almost single-handedly produces the brand average of 8.97%. That's where improvement should start, too.
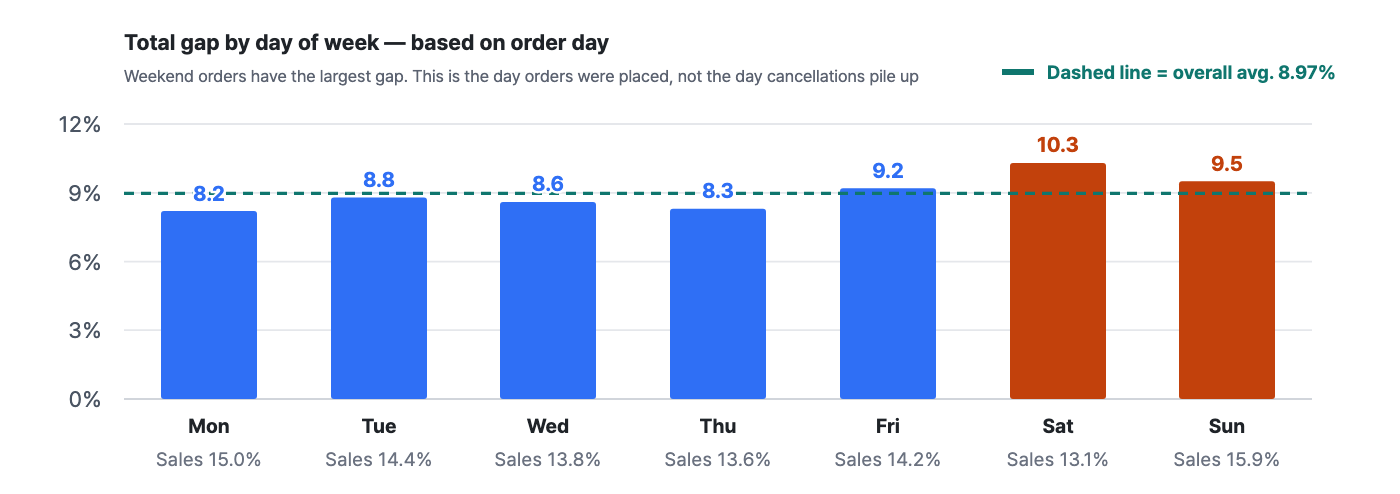
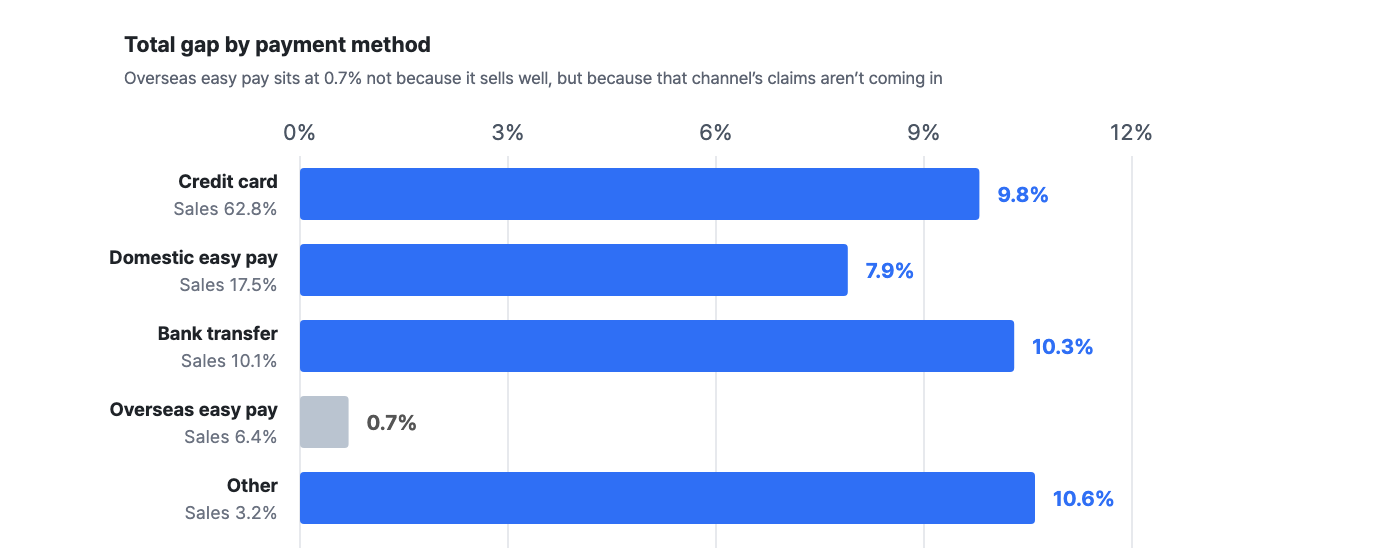
Use day of week and payment method to narrow down the cause
Next screen — all the numbers so far rest on the assumption that all claim data comes in. In reality, some channels don't send it.
PART 07 · Pitfalls — be suspicious of 0% gaps first
If you push this part to the end, you'll end up taking the numbers in the earlier parts at face value.
Pitfall ① A 0% gap doesn't mean “no returns” — it means “no data”
In the table above, the total gap for offline · wholesale is exactly 0.00%. No real-world channel has zero returns. What's actually happening is that claim data from these channels isn't flowing into Laplace. For this brand, there were 15 such channels, accounting for 2.7% of sales and 17,400 orders.
The unusually small gaps for the overseas own store (0.68%) and overseas easy pay (0.7%) may have the same cause. Before reading it as “a small gap is good,” check first whether claims are connected. The smaller a channel's gap, the more suspicious you should be.
How to check
-
In Data Management › Connected Channels, check whether claims are being collected for each channel.
-
Pull claim counts by channel and flag the ones with 0. If a channel has thousands of orders but 0 claims, it's an integration problem.
-
Exclude channels that can't be integrated (wholesale, offline, etc.) from the gap calculation, and state in the report that you excluded them. If you mix them in, the brand's average gap comes out lower than it really is.
Pitfall ② Don't mix count-based return rates with amount-based gaps
The benchmark's “online return rate of 19.3%” is based on order count. This report's 8.97% is based on amount. A partial cancellation or exchange counts as one order but removes only part of the amount, and if many low-priced items are returned, the count can be high while the amount gap stays small. Two numbers being different doesn't mean the data is wrong. When comparing, only compare like with like.
Pitfall ③ For day-of-week gaps, always check whether it's “order day” or “cancellation day”
The day-of-week chart above is based on the day the order was placed. The common belief that “weekend cancellations pile up on Monday” is based on the day the cancellation was filed, which produces the exact opposite shape. Both views are valid, but if you don't say which one you're using, the conclusion flips.
| Checkpoint | Standard | If it fails |
|---|---|---|
| Claim integration by channel | Claims collected from every channel that has orders | Gap shows as 0, skewing the brand average downward |
| Gap calculation period | Exclude the most recent 2 weeks (after confirming they've settled) | Gap underestimated by half or more |
| Basis of comparison | Don't mix count vs. amount | Numbers diverge from the benchmark, making you doubt the data |
| Day-of-week / period axis | State explicitly that it's based on order date | The conclusion flips to the exact opposite |
4-week action plan
| Week | What to do | Done when |
|---|---|---|
| W1 | In Data Management › Connected Channels, audit claim integration across all channels. Connect any unconnected channels, or exclude them from the gap calculation | List of channels with 0 claims · exclusion reasons documented |
| W2 | Build a “Same-day Sales vs Confirmed Sales” chart in Custom Dashboard and save it at a daily level. Check from which point the last few days on the right stabilize | Your brand's days to settle · baseline gap ratio |
| W3 | In Product Analysis › By Product, pull the gap by product and flag the top 10. Compare promo and bundle products against always-on products | List of top-gap products · multiple vs. event products |
| W4 | Switch your sales reporting basis to Confirmed Sales and show same-day sales alongside as a “preliminary figure.” Recalculate ad performance as confirmed-basis ROAS too. Register a gap spike alert in Custom Alerts | Report format updated · confirmed-basis ROAS table · 1 alert |
Summary
-
100 in orders becomes 91.03 confirmed. A total gap of 8.97% — within the benchmark's “typically 5–15%.”
-
The problem isn't the size, it's the timing. The same-day dashboard shows only 45.5% of that gap.
-
Don't read the last few days. The settled-day average is 5.22%, but the last 3 days come in at -4.40%.
-
The gap sticks to products, not dates. Spike days vs normal days show no real difference at 8.6% vs 9.0%, but event products vs always-on products split 2.16x at 11.9% vs 5.5%.
-
Be suspicious of channels with a 0% gap first. 15 channels (2.7% of sales) had no claim integration.
Minimum setup to reproduce this report with your own data
| Item | Value | Why |
|---|---|---|
| Measures | “Same-day Sales” + “Confirmed Sales” at the same time | The gap only shows when the two sit side by side |
| Aggregation unit | Day | Monthly aggregation blurs the confirmation lag pattern |
| Date range | 11 months or more, excluding the most recent 2 weeks | Unsettled periods cause the gap to be underestimated |
| Gap definition | Total gap = (order sales − confirmed sales) ÷ order sales | Putting same-day close sales in between splits it into a · b |
| Breakdown axes | Channel · product · product type · day of week · payment method | A single brand average gives you nothing to act on |
| Exclude | Channels without claim integration | Mixing them in skews the brand's average gap downward |
| Day-of-week basis | Order date (not cancellation filing date) | If you don't state the basis, the conclusion flips |
Frequently asked questions
Q. What is a typical gap between same-day sales and confirmed sales?
It varies by brand, but it's usually in the 5–15% range, with category being the biggest factor. In this sample, it was 8.97%. That said, the right answer isn't someone else's average — it's your own brand's average gap over the last 3 months, accounting for your settling period.
Q. So is there no need to look at real-time sales?
Not at all. Real-time sales are essential for catching same-day trends, such as detecting spikes and drops or monitoring live commerce broadcasts. The problem is using that number as-is for performance reviews, budgets and purchase orders. Keep the uses separate.
Q. If the gap ratio suddenly jumps, what should I look at?
Three things, in order — ① whether the share of promo and bundle products has grown (a 2.16x difference in this sample), ② whether it's concentrated in a particular product (a signal about quality or expectation management), and ③ whether it's drop-off at the payment stage, such as unpaid bank transfers. A sudden shift in the gap is usually an early warning of an operational problem.
Q. Our gap is under 1% — does that mean we're doing well?
First, check your claim integration. In this sample too, 15 channels showed a 0.00% gap, and every one of them turned out to be missing data integration. If integration is working properly and the gap is still under 1%, it's most likely that you're in a low-return category or that you're looking at a period whose confirmation lag hasn't passed yet.
Q. Which sales basis should I use to evaluate ad performance?
The ROAS reported by ad platforms is based on the time of order, so it doesn't reflect later cancellations and refunds. Use it for reference, but make comparisons between campaigns and decisions to pause them on ROAS based on confirmed sales. If the gap differs by campaign, the ranking itself changes.
References: NRF & Happy Returns “2025 Retail Returns Landscape” · Radial “The State of Retail Returns 2025” · Capital One Shopping Research (2026) · Claimlane “Why Customers Return Products” (2026) · Statista Bracketing Survey (2025) · True Fit (2025)
The figures in this report are not real transaction data. They are illustrative values generated to reflect the distribution of Laplace benchmark metrics. They do not represent any specific customer, so please use them to understand trends rather than as absolute values. Public research figures cite their sources in each entry. Screen names and setting names may differ slightly depending on the release.