5 Reviews, +270% Purchase Likelihood — How Reviews Move Sales and How to Put Them to Work
“We know reviews matter — but do they actually move sales?” Published research answers with a clear yes. How much a revi
“We know reviews matter — but do they actually move sales?” Published research answers with a clear yes. How much a review is worth to your own store, though, is a different question. This report uses research figures to set a baseline, then walks through what you actually see when you join review data with order data — and what is easy to misread.
Review and order data (illustrative) from two brands on a fashion vertical platform · 100+ listings · about 2,300 reviews · channel names are kept generic
The figures in this report are not real transaction data; they are illustrative values generated to reflect the distribution of Laplace benchmark metrics. They are not the actual figures of any specific customer — please use them to understand trends, not as absolute values.
This report covers five things.
-
How many orders and how many days it really takes to collect the first 5 reviews
-
When reviews get written after an order — the timing of review requests
-
The traps that are easy to fall into when you look at review counts against sales
-
What the reviews rated 3 stars or below are telling you behind a 4.7 average
-
How to treat reviewers in your CRM — and the break-even point of review reward points
PART 01 · First — which screen to open
Review analysis starts by putting review data and order data in the same place.
| What you look at | Where to open it in Laplace | Which figure in this report | Priority |
|---|---|---|---|
| Are reviews coming in? | Data Connections › Sales Channels (Admin Connection) | Whether reviews are collected · collection period | 1 |
| Review count and star rating per listing | Custom Dashboard › Add Chart › Data: Reviews | Review rate 6.8% / 7.6% | 1 |
| Days from order to review | Custom Dashboard › Review × Order combined chart | Median 27 days / 10 days | 2 |
| What low-rated reviews say | AI Agent › ask for a review summary | 3 stars or below: 5.7% / 7.1% | 2 |
| Repeat purchases by reviewers | User Analytics › First Purchase / Repurchase + reviewer filter | 1.9x / 1.46x | 3 |
You only need to build one or two new charts
Next screen — The screens are set. Before that, let’s set a baseline with other people’s numbers. On to PART 02. ›
PART 02 · How much do reviews affect sales? — The numbers research has confirmed
These findings come from Northwestern University’s Spiegel Research Center, which analyzed large-scale purchase data together with review platform PowerReviews.
| Condition | Compared with no reviews |
|---|---|
| Product with 5 reviews | Purchase likelihood +270% |
| Reviews shown on a lower-priced product | Conversion rate +190% |
| Reviews shown on a higher-priced product | Conversion rate +380% |
The effect is larger for expensive, high-involvement products. The higher the price, the riskier the purchase — and reviews take that risk off the shopper’s shoulders. The biggest effect comes from the first 5 reviews. After that, the marginal value of each additional review drops quickly.
| Reviews on the product | Conversion lift (vs. 0 reviews) |
|---|---|
| 1 or more | +52.2% |
| 11–30 | About 2x |
| 31–50 | +314.6% |
| 51–100 | +378.0% |
A higher star rating is not always better, either. Looking across more than 40 categories, the same research team found that purchase likelihood peaks at ratings of 4.2–4.7 and actually declines as ratings approach 5.0. A perfect score reads as “too good to be true.”
-
82% of consumers deliberately seek out negative reviews (PowerReviews).
-
Reviews written after a post-purchase request averaged 4.34 stars, versus 3.89 for unsolicited reviews. Leave it alone, and only unhappy customers’ voices pile up.
-
73% of consumers mainly rely on reviews posted within the past month (BrightLocal). Even with plenty of reviews overall, a product without recent ones looks abandoned.
-
Analyses show photo reviews are viewed about 2x more often than text reviews and lift conversion by around 15% (PowerReviews · Bazaarvoice).
So far, these are other people’s numbers
Next screen — We now know “the first 5 matter most.” What we don’t know yet is what it costs to collect those 5. On to PART 03. ›
PART 03 · Priority 1 — The first 5 reviews don’t come on their own
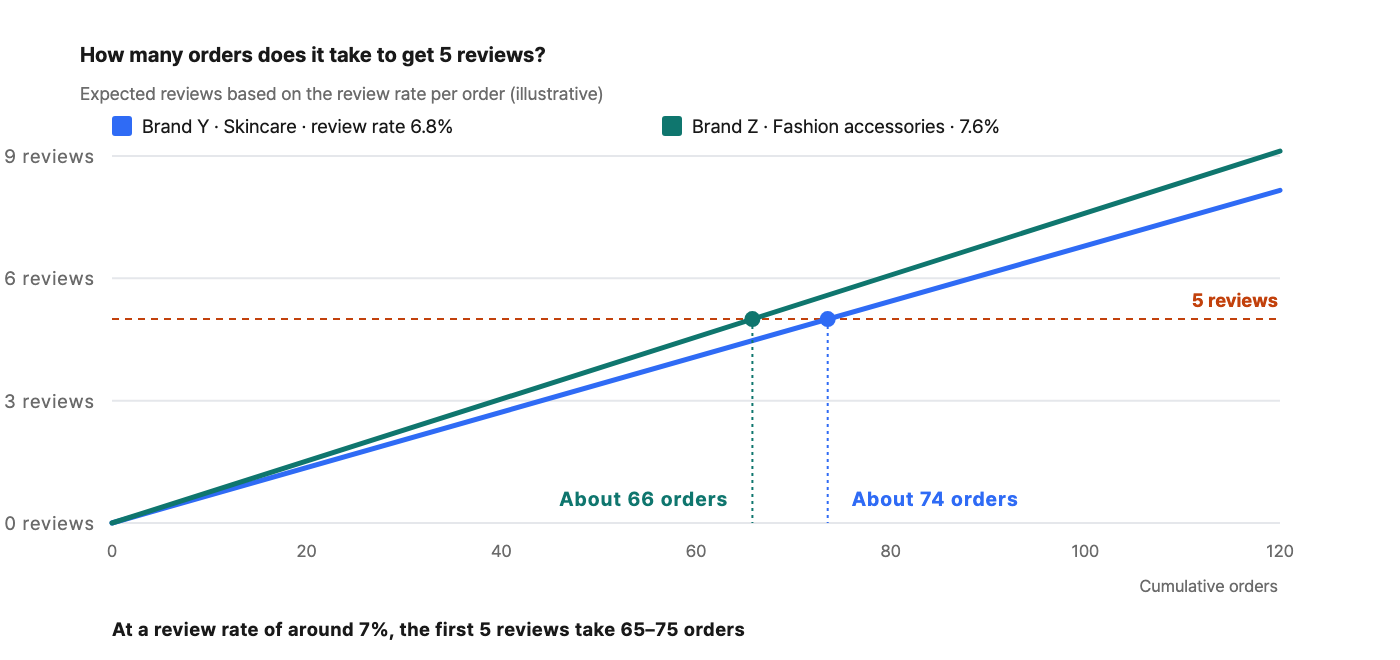
With a review rate of around 7% of orders, 5 reviews means roughly 70 orders and about two months.
The figures in this report are not real transaction data; they are illustrative values generated to reflect the distribution of Laplace benchmark metrics. They are not the actual figures of any specific customer — please use them to understand trends, not as absolute values.
| Brand Y (skincare) review rate per order | Brand Z (fashion accessories) review rate per order | Time for a Y listing to reach 5 reviews (median) | Time for a Z listing to reach 5 reviews (median) |
|---|---|---|---|
| 6.8% | 7.6% | 71 orders · 76 days | 64 orders · 53 days |
Where to look in Laplace — Custom Dashboard › Add Chart › Data: Reviews + Orders
How to set it up
-
In Add Chart, choose “Reviews” as the data, “Review Count” as the measure and “Product” as the dimension. — The baseline is how many reviews each listing has.
-
For the same period and the same sales channel, pull “Order Count” by product from the order data. — The review rate is only accurate when the review channel and the order channel match.
-
Divide review count by order count to get the review rate. If you mix channels, orders from channels that don’t collect reviews end up in the denominator and the review rate drops to half or less.
-
Filter to listings with fewer than 5 reviews and calculate the orders needed as “reviews still missing ÷ review rate.” — This number becomes the target for reward points and review-request messages.
How to read the numbers
-
Fewer than one in ten orders gets a review. Review rates were 6.8% and 7.6%. Even across different categories, they stayed close to 7%.
-
That makes the “first 5” more expensive than you think. At the listing median, Y took 71 orders and 76 days, Z took 64 orders and 53 days. In other words, listings spent more than two months selling without reviews during the very stretch where research says reviews matter most.
-
New and low-volume listings wait the longest. A listing with 20 orders a month and a 7% review rate needs three and a half months to reach 5 reviews. This is where focused support for the first 5 should go.
Next screen — We know how many orders it takes. What we don’t know yet is when to ask so that reviews actually get written. On to PART 04. ›
PART 04 · When do reviews get written? — The product decides the timing of your request
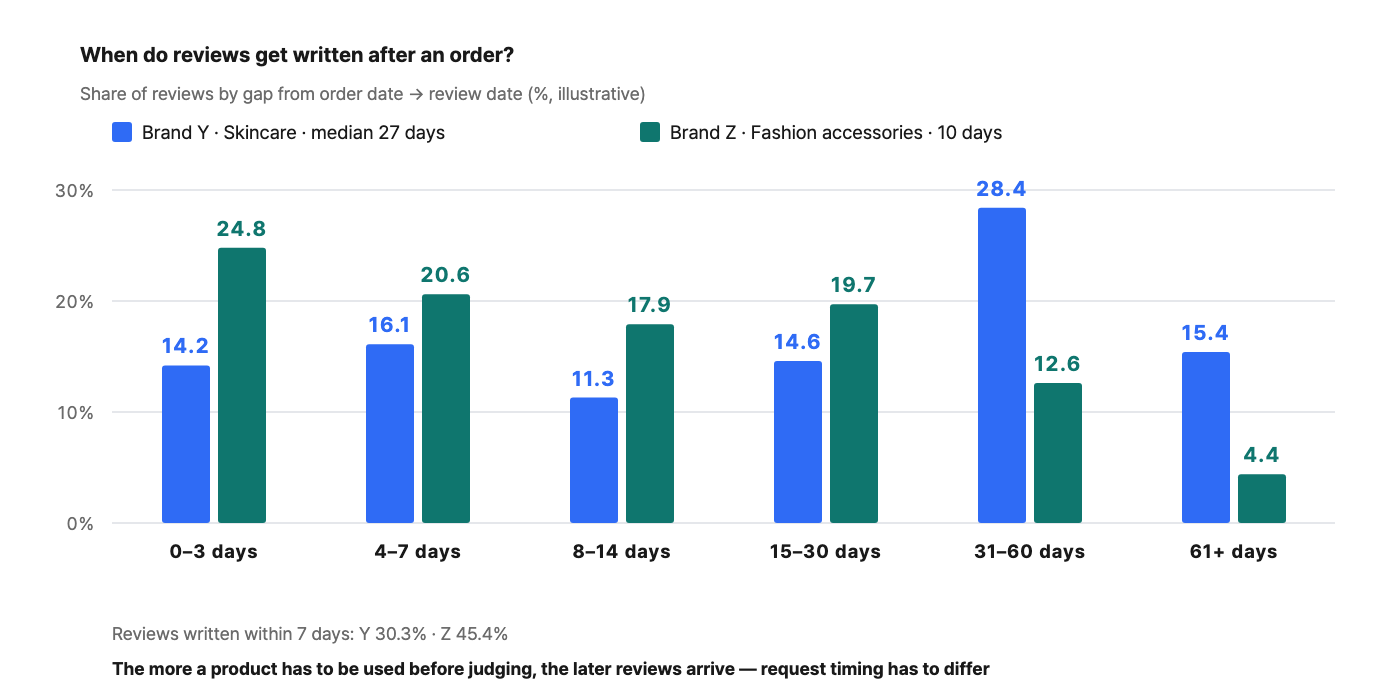
The gap between order and review differs almost threefold from category to category.
Where to look in Laplace — Custom Dashboard › Review × Order combined chart
How to set it up
-
First check that the review data contains order numbers. — You can’t measure the gap for reviews with no order number (PART 08, Trap ③).
-
Split the gap into 0–3 days · 4–7 days · 8–14 days · 15–30 days · 31–60 days · 61+ days and count the share of reviews in each.
-
Look at each product group (category) separately. — If products you have to use before judging are mixed in one table with products you can judge on arrival, both medians come out wrong.
| Metric | Brand Y (skincare) | Brand Z (fashion accessories) |
|---|---|---|
| Median | 27 days | 10 days |
| Bottom 25% / Top 25% | 6 days / 49 days | 3 days / 23 days |
| Reviews written within 7 days | 30.3% | 45.4% |
| Reviews written within 30 days | 56.2% | 83.0% |
How to read the numbers
-
Fashion accessories get reviewed right away. 45.4% of Z’s reviews came in within a week. Customers know as soon as they try the item on. The right time to ask is 2–3 days after delivery.
-
Skincare gets reviewed after use. For Y, the 31–60 day bucket is the largest at 28.4%, and only 56.2% of reviews arrive within 30 days. Asking right after delivery just produces more “not sure yet” reviews.
-
So ask twice, not once. For products customers need to use before judging, split the request into a “first impressions” ask right after delivery and an “after use” ask 3–4 weeks later. The second request is what brings in photo reviews and concrete feedback on how the product feels.
“I’ll update after a month” rarely comes back
Next screen — We’ve settled when to ask. Now let’s check with our own data whether review count really connects to sales volume. On to PART 05. ›
PART 05 · Review count and sales volume — visible correlation, hidden traps
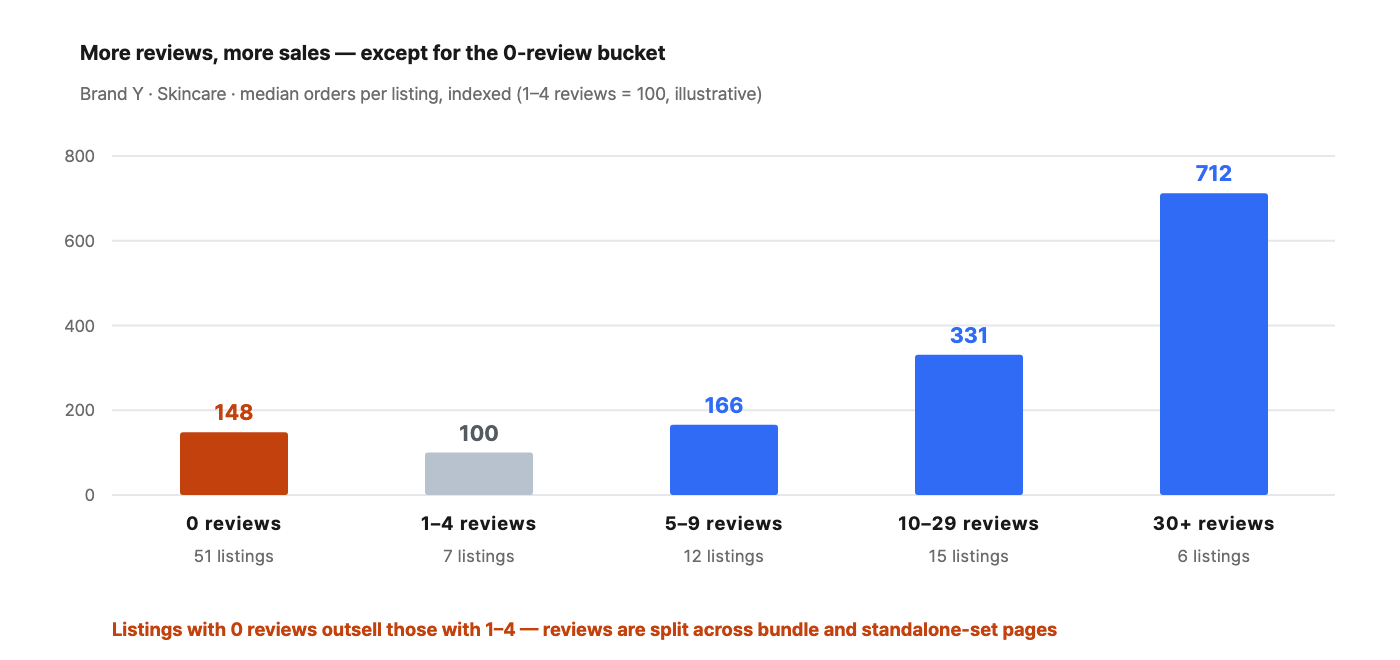
It’s true that listings with more reviews sell more. But the numbers don’t tell you which way the arrow points.
Where to look in Laplace — Custom Dashboard › Review count × Order count by listing table
How to read the numbers
-
Going from 1–4 reviews to 30 or more multiplies median orders by 7. Index 100 → 166 → 331 → 712. This matches the direction of the research.
-
But listings with 0 reviews sell better than those with 1–4 (index 148). Listings with 0 reviews make up 56.0% of all listings (51) yet take 46.3% of orders. Look closer and most of them are bundle, standalone-set or promotion pages. Reviews for the same product pile up on a single-item page, while the bundle pages sell with no reviews at all.
-
You rarely see sales jump around the 5th review. Comparing orders 28 days before and after for the 32 listings that reached 5 reviews, 17 rose and 15 fell — almost a coin toss. Launch spikes, promotions and ads drown out the review effect.
Why you can’t take these numbers at face value — the most important part of this chapter
Show reviews on bundle pages too
Next screen — We’ve looked at the “number” of reviews. Now it’s the “content” — is a 4.7-star average good enough? On to PART 06. ›
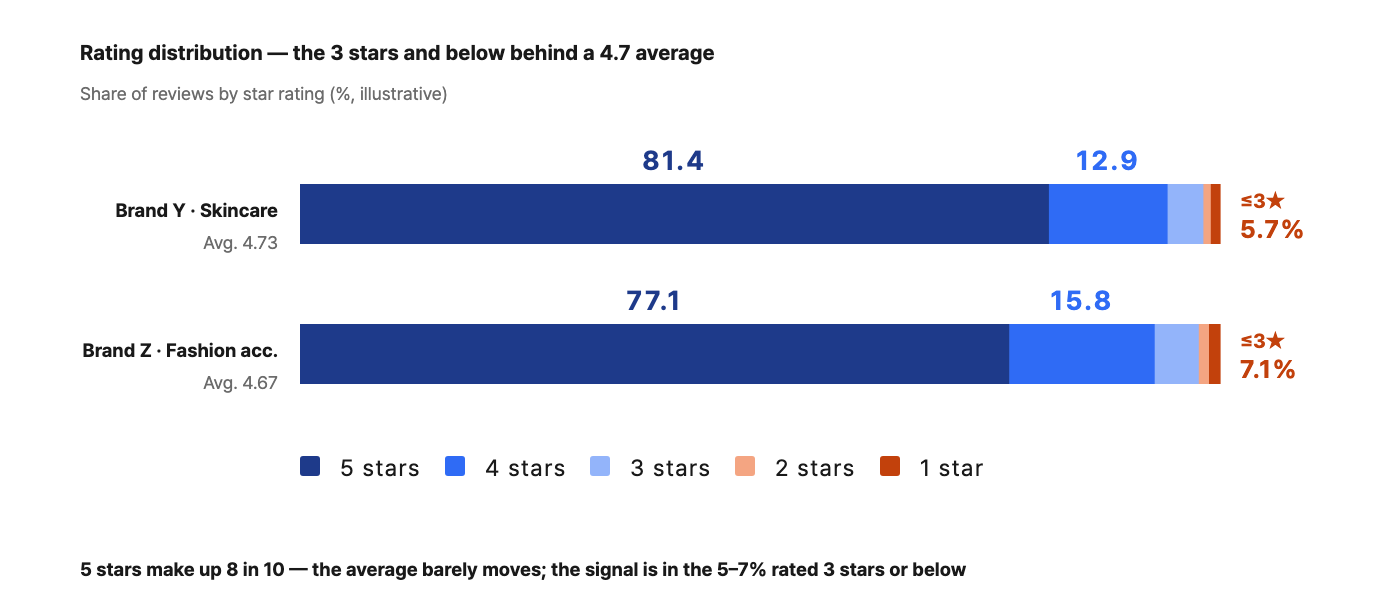
PART 06 · Star ratings — the 3 stars and below behind a 4.7 average
With 5-star reviews making up about 8 in 10, the average barely moves. The signal lies in the 5–7% rated 3 stars or below.
Where to look in Laplace — Custom Dashboard › Add Chart › Data: Reviews › Measure “Average Rating” · Dimension “Rating”
How to read the numbers
-
Both brands sit at the upper end of the optimal range the research describes. Averages of 4.73 and 4.67. Raising the average further from here is pointless.
-
What you need to watch is the 5.7% and 7.1% rated 3 stars or below. That’s just 6–7 out of every 100 reviews — but these are exactly the reviews 82% of consumers go looking for.
-
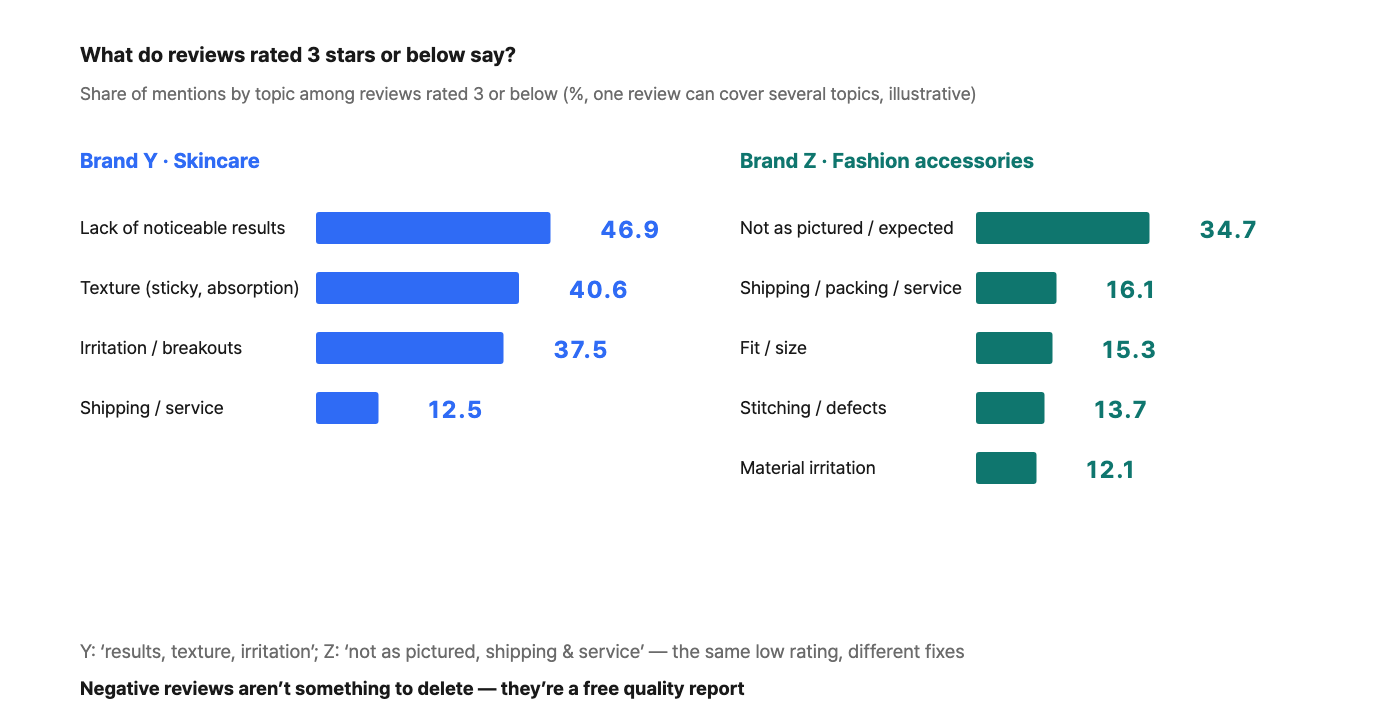
Low ratings in skincare speak about the product itself. For Y: lack of noticeable results 46.9%, texture and feel 40.6%, irritation and breakouts 37.5%. The first things to fix are expectations set on the product page (phrases like “in just 3 days”) and guidance on the formula.
-
Low ratings in fashion accessories speak about expectations and operations. For Z: different from photos/expectations 34.7%, shipping/packaging/customer service 16.1%. Before changing the product, fix the detail photos and on-model shots and how exchanges are handled.
Photo reviews made up 79.8% of Y’s reviews and 64.1% of Z’s. The difference in average rating between photo and text reviews is within 0.1 stars, so getting more photo reviews won’t shake your rating.
Next screen — We’ve covered how to read reviews. Finally, let’s look at the people who wrote them. On to PART 07. ›
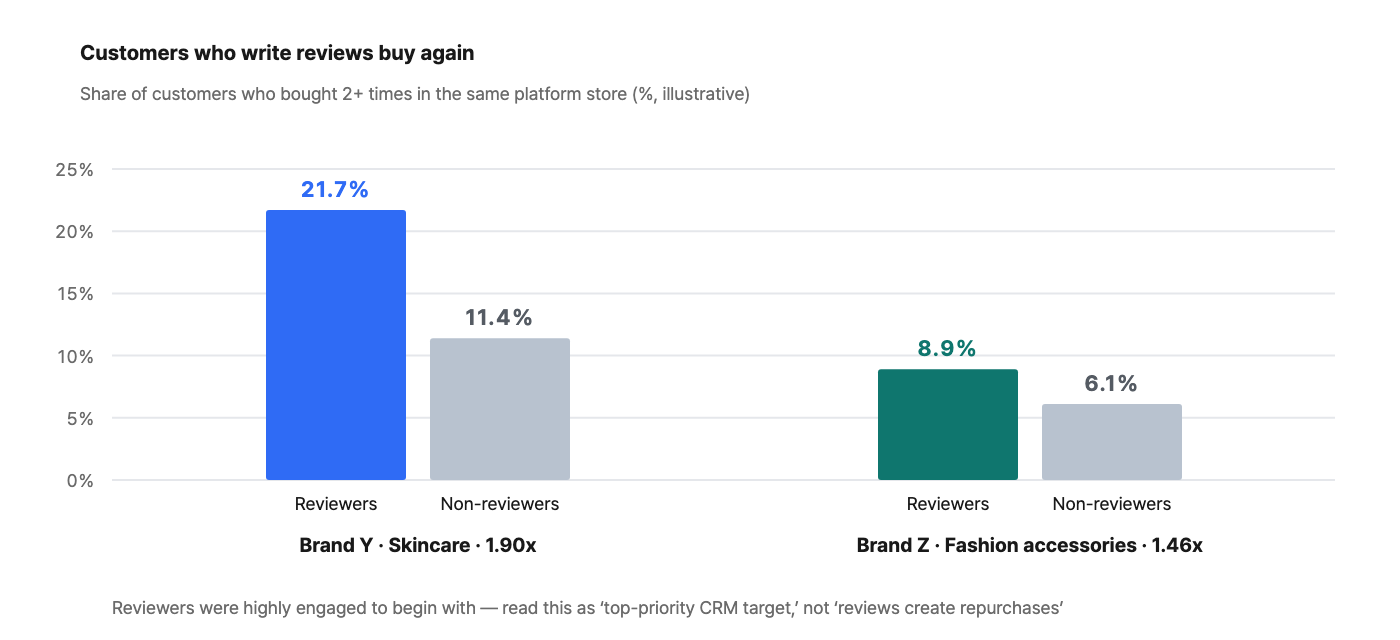
PART 07 · Customers who write reviews — 1.5–1.9x more repeat purchases
Customers who wrote a review are clearly more likely to buy again from the same store. How you interpret that, however, matters.
Where to look in Laplace — User Analytics › First Purchase / Repurchase
| Group | Customers | 2+ purchases | Orders per customer |
|---|---|---|---|
| Brand Y (skincare) · Reviewers | 172 | 21.7% | 1.29 |
| Brand Y (skincare) · Non-reviewers | 2,315 | 11.4% | 1.14 |
| Brand Z (fashion accessories) · Reviewers | 281 | 8.9% | 1.12 |
| Brand Z (fashion accessories) · Non-reviewers | 5,140 | 6.1% | 1.07 |
How to read the numbers
-
The direction is the same for both brands. The repeat-purchase share is 1.9x for Y and 1.46x for Z. Despite the different categories, reviewers came back more often.
-
Still, don’t read this as “getting customers to write reviews increases repurchases.” Customers who write reviews were already highly engaged with the brand. The review is a marker, not a cause.
-
That’s why reviewers are your top-priority CRM target. Send repurchase coupons, new-product tester invitations and second-round “after use” review requests to this list first. Especially for skincare, which customers judge after use, the moment right after the first review is the best time to suggest a repeat purchase.
Next screen — Every number so far assumes the review data is clean. In reality, it often isn’t. On to PART 08. ›
PART 08 · Traps — four reasons not to take review data at face value
Unless you check these four things first, every number above is on shaky ground.
Trap ① Rating scales come in differently by channel
Of 438 reviews for one brand imported from a different vertical platform, 88.6% were rated 0–1. Yet the text said things like “I’d buy again” and “I gave it as a gift and they loved it.” The ratings had come in on a different scale, not out of 5. Merge them as-is and the average rating drops into the 1s, and every product on that channel gets classified as a “quality problem.”
How to check
Trap ② The same review comes in twice, the same sentence ten times
During collection, duplicate reviews piled up at a rate of 4.8% for Y and 7.1% for Z. On top of that, 6.4% of Z’s reviews were word-for-word identical sentences repeated 4 or more times — lines like “Always great products, thanks for the fast shipping.” These are most likely perfunctory reviews written for events or reward points.
-
When counting reviews, remove duplicates based on the review ID (or order number + review text).
-
Count repeated-sentence reviews in the “review count,” but exclude them from text and keyword analysis. Otherwise “fast shipping” will show up as the most common praise.
Trap ③ Some reviews don’t link to an order
19.3% of Z’s reviews had a blank order number and couldn’t be linked to an order. These reviews count toward the review total but drop out of the timing analysis in PART 04 and the repurchase analysis in PART 07. A review rate calculated only from order-linked reviews comes out lower by that much.
Trap ④ Mixing sales channels cuts the review rate in half
Usually only some channels collect reviews. If orders are summed across all channels while reviews come in from just one, the review rate is calculated at half the real figure or less. Always narrow review-rate and repurchase comparisons to the one sales channel that collects reviews. Customer identification is also separate for each channel, so this method can’t see repeat purchases across channels.
It doesn’t have to be perfect
Next screen — Now the data can be trusted. Finally, let’s calculate whether review reward points pay for themselves. On to PART 09. ›
PART 09 · Review reward points: cost or investment? — The break-even lift
Calculate with ratios rather than amounts, and you can plug in your own numbers directly.
Break-even lift = total reward points ÷ (revenue of target listings × Contribution Margin Rate)
| Assumption (illustrative) | Value |
|---|---|
| Total reward points (as a share of target listings’ monthly revenue) | 1.0% |
| Contribution Margin Rate of target listings | 25% |
| Break-even lift | 1.0% ÷ 25% = 4% |
| Effect of 5 reviews according to research | Purchase likelihood +270% |
Even 1/70 of the research figure gets you to break-even. The math works even with a conservative haircut. But this applies to “building the first 5 reviews on a listing with 0 reviews.” Spend the same reward points on a listing that already has more than 30 reviews, and the marginal value is so small you may not break even.
-
Tier your reward points — Weight photo reviews over text, and weight the first 5 reviews. Concentrate the same budget where the effect is largest.
-
Design the measurement at the same time — Split similar listings into two groups, turn on reward points for only one, and compare over 4 weeks. As PART 05 showed, a simple before/after comparison gets buried under promotions.
-
Don’t buy perfunctory reviews — A rise in repeated-sentence reviews signals that your reward points are buying only the “number” of reviews (PART 08, Trap ②).
4-week action plan · 4-week action plan
| Week | To-do | Screen to open |
|---|---|---|
| Week 1 | Confirm which channels collect reviews; check duplicates, rating scales and reviews not linked to orders (PART 08) | Data Connections › Sales Channels |
| Week 1 | Build the review count × order count by listing table and calculate review rates | Custom Dashboard › Add Chart |
| Week 2 | List listings with fewer than 5 reviews + calculate the orders needed; sort out review display on bundle pages | Custom Dashboard |
| Week 2 | Reset request timing based on review lag by category (2 steps: first impressions / after use) | Review × Order combined chart |
| Week 3 | Classify topics of reviews rated 3 stars or below → list of product-page and customer-service fixes | AI Agent |
| Week 3 | Send repurchase offers to the reviewer customer segment | User Analytics › First Purchase / Repurchase |
| Week 4 | Compare listings with reward points on vs. off; check results against the break-even lift | Custom Dashboard |
Summary · Summary
-
Only about 7% of orders get a review — the first 5 take 64–71 orders and roughly two months.
-
The product decides request timing — fashion accessories: 45.4% within a week; skincare: 56.2% within 30 days.
-
Listings with 0 reviews take 46.3% of orders — because reviews are split across bundle and standalone-set pages.
-
Read the 5.7–7.1% rated 3 stars or below, not the 4.7 average — that’s where the fixes are.
-
Reviewers repurchase at 1.46–1.9x the rate — not a cause, but a marker of your top-priority CRM target.
Minimum setup to reproduce this report with your own data
| Item | Setting |
|---|---|
| Sales channel | Fix to the one channel that collects reviews |
| Period | From the day review collection started (exclude earlier orders from the denominator) |
| Review deduplication | By review ID, or order number + review text |
| Lag buckets | 0–3 · 4–7 · 8–14 · 15–30 · 31–60 · 61+ days |
| Review-count buckets | 0 · 1–4 · 5–9 · 10–29 · 30+ reviews |
| Repurchase definition | 2 or more purchases within the same channel |
FAQ · Frequently asked questions
Q. How many reviews are enough?
The first 5 matter most, and the effect tapers off after that. Getting 5 reviews on every listing is the top priority. At a review rate of around 7%, that takes roughly 70 orders — so start by supporting new products with low sales.
Q. When should I send review requests?
For products customers can judge on arrival (such as fashion accessories), 2–3 days after delivery; for products they need to use first (such as skincare), twice — right after delivery and again 3–4 weeks later. Measure the lag for your own products directly as review date − order date.
Q. Should I aim for a 5.0 rating?
No. Purchase likelihood is highest in the 4.2–4.7 range. Rather than pushing up the average, reading the topics of reviews rated 3 stars or below and fixing your product pages, products and customer service does more for conversion.
Q. Should I delete negative reviews?
Responding beats deleting. 82% of consumers deliberately seek out negative reviews. Negative reviews are also a quality report you get for free.
Q. Products with many reviews sell well — so will more reviews raise sales?
The direction is right, but the numbers alone don’t prove it. Part of it is reviews piling up because the product sells well. You can only talk about an effect by splitting similar listings, switching on a review campaign for just one group and comparing.
Review count × orders, review lag, ratings × review text, and repeat purchases by reviewers — see the relationship between your review data and sales for yourself in Laplace.
References: Spiegel Research Center (Northwestern Univ.) “How Online Reviews Influence Sales” · PowerReviews “The Impact of Review Volume on Conversion” · BrightLocal “Local Consumer Review Survey” · Bazaarvoice “Shopper Experience Index”
The figures in this report are not real transaction data; they are illustrative values generated to reflect the distribution of Laplace benchmark metrics. They are not the actual figures of any specific customer — please use them to understand trends, not as absolute values. Figures from published research are cited with their sources. Screen and setting names may vary slightly by release.