"The numbers don't match the admin" — 4 reconciliation checks before you trust your dashboard
We recounted the same period's sales for 7 brands using several different bases. Changing just one setting made sales di
We recounted the same period's sales for 7 brands using several different bases. Changing just one setting made sales differ by as much as 4.7x.
The first thing a team does after switching on a dashboard is check its numbers against the channel admin. And most of the time, they don't match. The conclusion is usually one of two — "the dashboard is wrong" or "the admin is wrong."
The figures in this report are not actual transaction data; they are illustrative values generated to reflect the distribution of Laplace benchmark metrics. They are not the actual figures of any specific customer, so please use them to understand trends rather than as absolute values.
PART 1. Which screens to open
A reconciliation check takes just four screens. Don't start by reading up on concepts — open these first.
| What to check | Screen | Which number in this report | Order |
|---|---|---|---|
| Which timestamp are you counting by | Dashboard › time basis in the period settings | Order-time coverage 21.3–100.0% | 1st |
| Are any products missing | Data Management › Product Matching Status | Matching rate 62.7–99.6% | 2nd |
| Are cancellations and refunds reflected | Sales Analysis › measure selection | Cancellation/refund layer 1.4–7.9% | 3rd |
| Is VAT included | Sales Analysis › measure selection | 9.09% (same for every brand) | 4th |
Where to look in Laplace — Dashboard › Period and Measure settings / Data Management › Product Matching Status
Next screen — Now you know the screens. Before moving on, let's see how costly this problem is. On to PART 2. ›
PART 2. The cost of numbers that don't match — figures confirmed by research
| Study | Confirmed figure |
|---|---|
| Gartner, Data Quality (2020, still widely cited) | Organizations are estimated to lose at least USD 12.9 million a year on average to poor data quality |
| Gartner, same source | Much of that cost arises not in systems but on the people side — reconciliation meetings, manual cross-checks, private spreadsheets |
"Up to here, these are other people's numbers"
Next screen — That's it for other people's numbers. Let's peel back the four layers one by one. On to PART 3. ›
PART 3. Layer one — the time basis (the biggest, and the hardest to see)
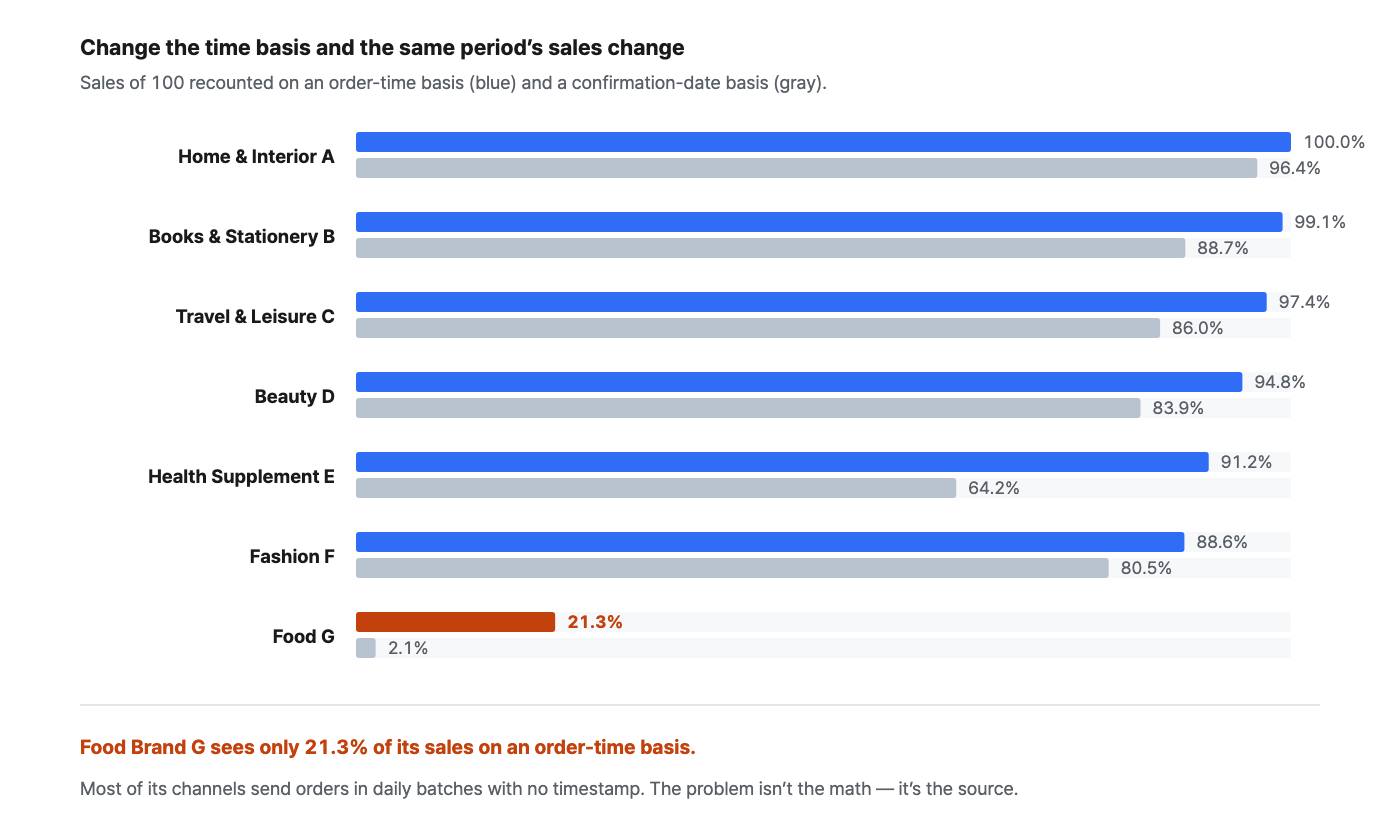
We recounted the same brand's sales for the same period on an order-time basis and on a confirmation-date basis. Values are indexed to the payment-time basis = 100.
| Sales visible on an order-time basis | Sales visible on a confirmation-date basis | Maximum difference within the same period |
|---|---|---|
| 21.3–100.0% | 2.1–96.4% | 4.7x |
How to set it up
-
Check the time-basis column in the dashboard's period settings. In most cases, people compare while it's still left at the default.
-
Check which timestamp the channel admin aggregates by. Payment time is the most common, while settlement screens often use the confirmation date.
-
Align the two and compare again. Very often, this one setting makes most of the difference disappear.
-
If a gap remains, check whether orders carry a timestamp at all. Channels that send orders in daily batches without times will be counted differently whichever basis you use.
How to read the numbers
-
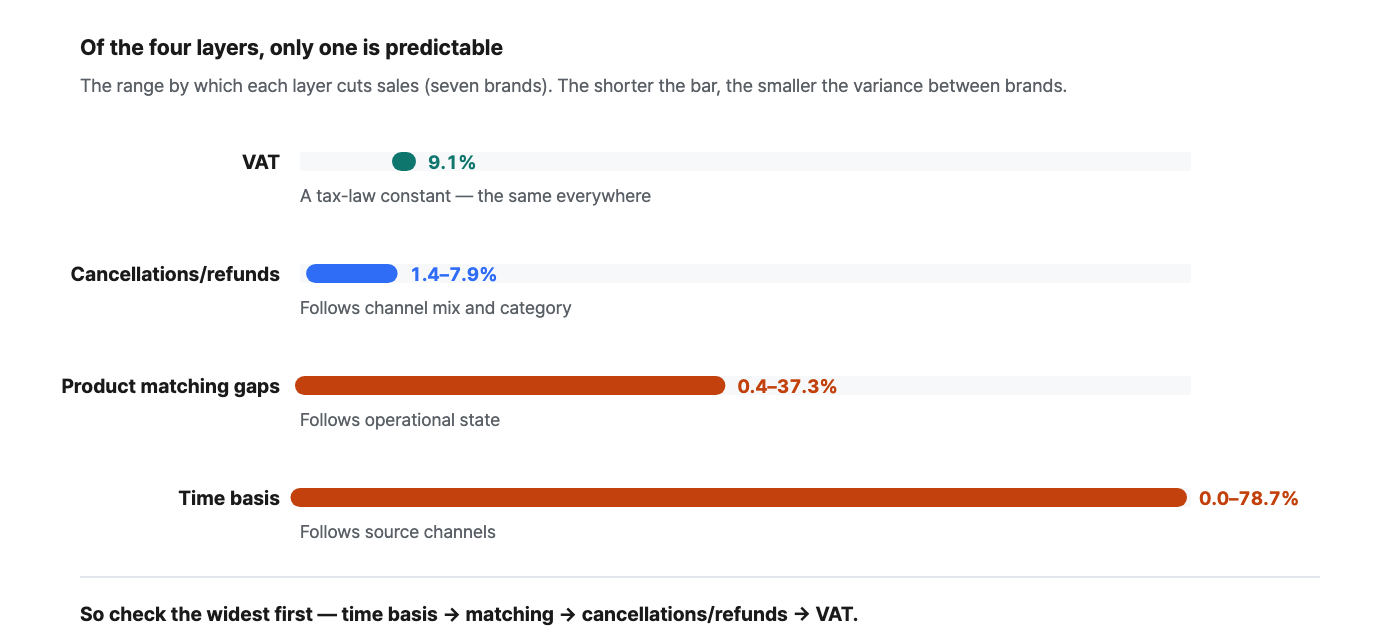
This is the biggest of the four layers. Sales visible on an order-time basis ranged from 21.3% to 100.0%. The three layers below are in single digits; only this one is on a different order of magnitude.
-
Food Brand G sees only 21.3% of its sales. Not because the calculation is wrong, but because its orders carry no timestamp. This is what happens when many of your channels — marketplace fulfillment, offline, wholesale — pass orders along in daily batches.
-
The confirmation-date basis is always smaller. Median 83.9%. Orders not yet confirmed drop out, and the more recent the period, the smaller it gets. Report on this basis at month-end and it looks as though sales have vanished.
Next screen — If the numbers still differ after aligning time, the next suspect is missing products. On to PART 4. ›
PART 4. Layer two — matching gaps
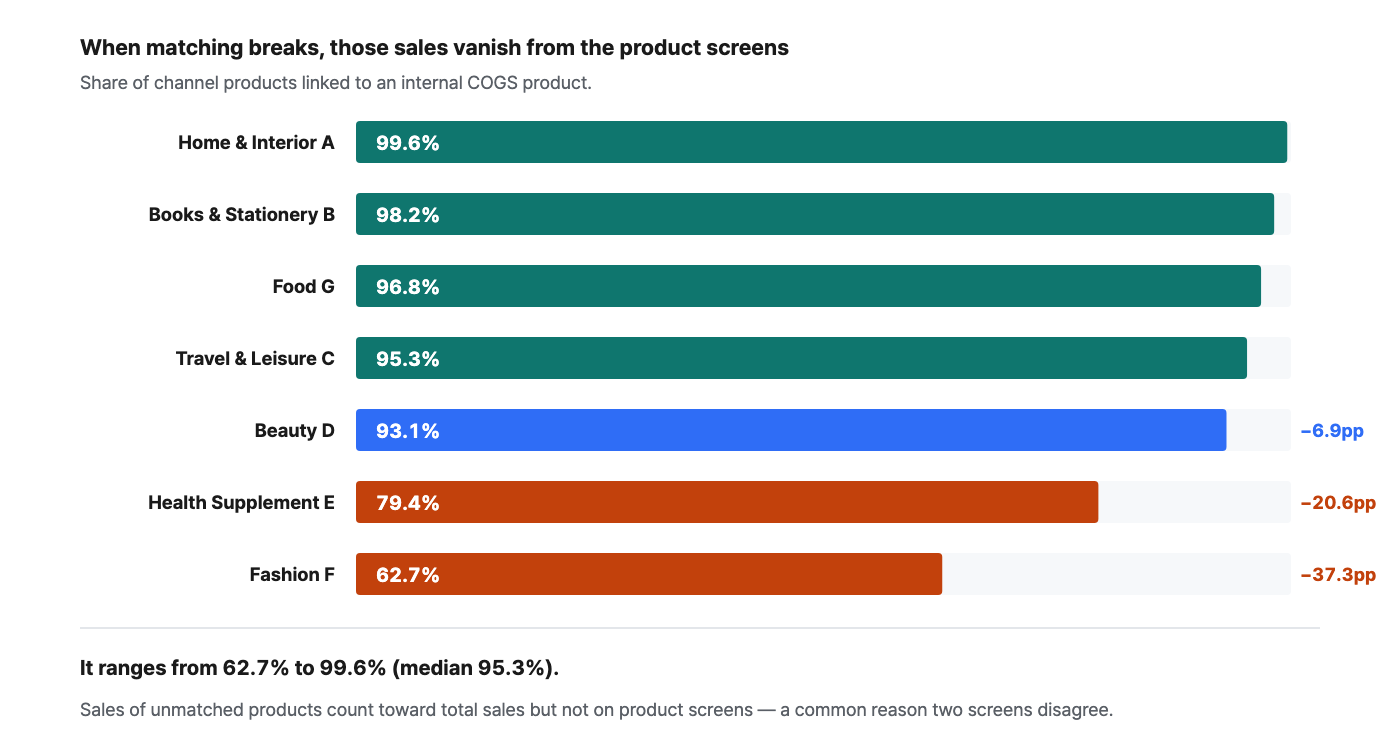
A product coming in from a channel only appears on product-level screens once it's linked to an internal COGS product. Sales of unlinked products are included in total sales but left out of product-level screens. It's a very common reason two screens don't match.
How to set it up
-
In Data Management › Product Matching Status, look at the total, matched and unmatched counts.
-
Sort the unmatched list by sales. Look at sales, not counts — most unmatched products are options that stopped selling long ago, and the problem lies in the top few.
-
Look first at months when new products, option expansions or bundled sets came in. That's usually when matching breaks.
-
After fixing things, run Recalculate Matching so the changes show up on screen. Simply saving won't change anything.
How to read the numbers
-
It ranges from 62.7% to 99.6%. Median 95.3%. It tracks not the size of the brand but its operational state — the faster the product turnover, the lower the rate.
-
Fashion Brand F has 37.3pp missing. In this state, adding up product-level sales won't match total sales, and it's easy to mistake the difference for a calculation error.
-
If your matching rate is below 95%, don't trust the rankings on product screens. The missing products may be near the top, and rankings swing far more sensitively than absolute values.
Next screen — The missing products are filled in. Next up: cancellations and refunds. On to PART 5. ›
PART 5. Layer three — cancellations and refunds
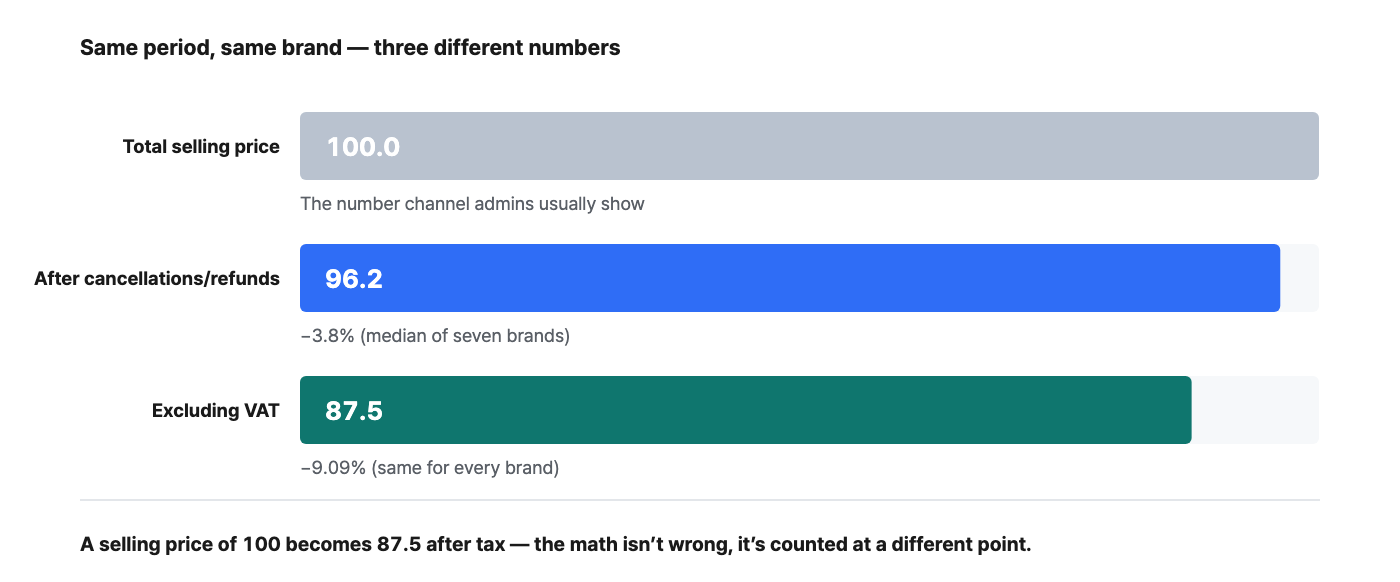
For each brand, we measured how much is left after subtracting cancellations and refunds from total selling price.
How to read the numbers
-
From 1.4% to 7.9%, with a median of 3.8%. It follows category and channel mix — the more returns a category gets, the bigger it is.
-
When the value was taken matters. This month's cancellations and refunds, viewed today, haven't fully accumulated yet. Compared with last month, this month always looks better — not because it improved, but because it hasn't matured yet.
-
Channel admins usually show selling price before cancellations. That's why the admin always shows a bigger number. This layer isn't about "who's right" but about "what you want to see."
Next screen — The last layer is the simplest. On to PART 6. ›
PART 6. Layer four — VAT
Subtract VAT from the value that already reflects cancellations and refunds, and you get the net-of-VAT amount. This is the one layer that doesn't depend on the brand.
The VAT layer is 9.09% everywhere
Stack all of these and a selling price of 100 drops to somewhere between 83.7 and 89.6. If the difference between two screens falls in this range, it's not a wrong number but a different definition.
Next screen — We've looked at all four layers. Now let's set the order. On to PART 7. ›
PART 7. The order matters
The four layers differ in size. Check the ones with the widest variance first and you'll finish faster.
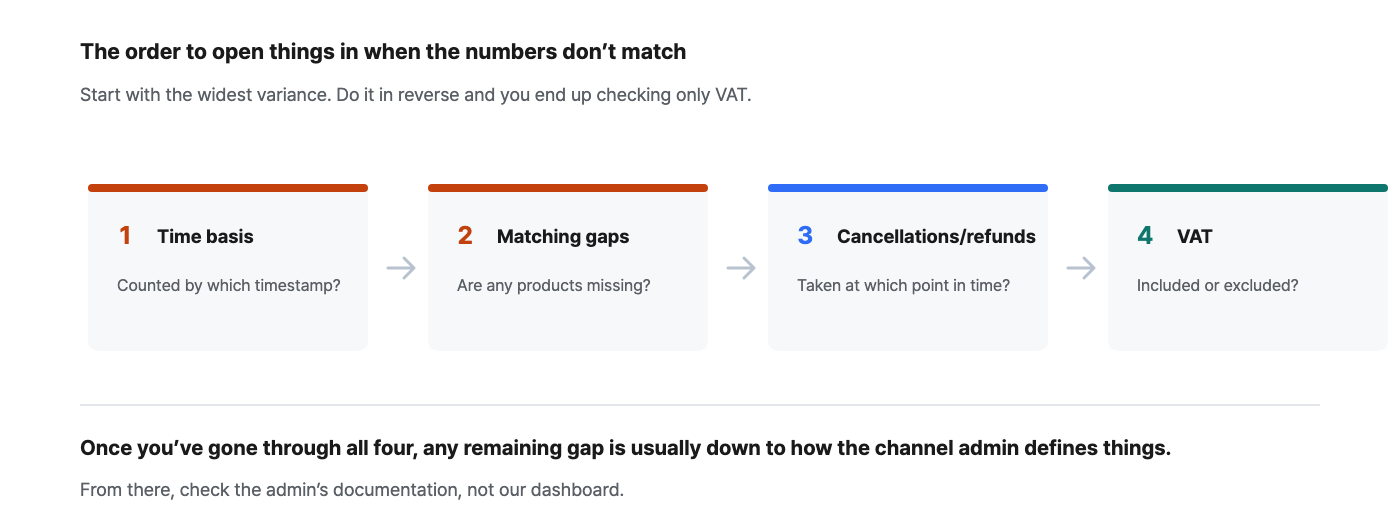
Do it in reverse and you waste time
Action plan — 30 minutes
| Step | What to do | Definition of done |
|---|---|---|
| 0–10 min | Check the time basis on both sides and align them | The dashboard and the admin count by the same timestamp |
| 10–20 min | Open Product Matching Status and review unmatched items by sales | You know what the top unmatched items are |
| 20–25 min | Check whether the measure is before or after cancellations and refunds | You can state the definitions of the two values being compared |
| 25–30 min | Check whether the remaining difference is around 9.09% | The VAT basis is aligned |
Summary
-
The time basis is the biggest layer. Sales visible by order time ranged from 21.3% to 100.0% — a difference of up to 4.7x.
-
Matching gaps split total sales from the product screens. Matching rates of 62.7–99.6%. Below 95%, don't trust product rankings.
-
Cancellations and refunds: 1.4–7.9%. They follow category, and the more recent the period, the less they have accumulated.
-
VAT is 9.09% everywhere. If the difference is around 9%, it's a question of basis, not calculation.
-
Go in order of variance, widest first. Time basis → matching → cancellations/refunds → VAT. Do it in reverse and you start with the thing that changes least.
Settings to reproduce this
| Item | Value |
|---|---|
| Period | Last 12 months (shorter windows let confirmation delays skew the results) |
| Time basis | Payment time · order time · confirmation date, once each |
| Measures compared | Total selling price · sales after cancellations/refunds · sales excluding VAT |
| Matching check | Data Management › Product Matching Status (total · matched · unmatched) |
| Sample | 7 brands · 12 months each |
Frequently asked questions
Q. Which number is the right one? It depends on the purpose. For ad efficiency, use sales after cancellations and refunds; for reconciling settlements, the confirmation-date basis; for P&L, sales excluding VAT. Picking one and applying it identically across all channels matters more than which one you pick.
Q. I aligned the time basis, but the difference is still large. Check whether orders carry a timestamp. If channels that arrive in daily batches are mixed in, no basis will make the numbers match. Separate out just those channels and compare them, and the cause becomes obvious right away.
Q. How high should the matching rate go? 100% is not the goal. Most unmatched items are options that stopped long ago. If total sales of unmatched products are below 1% of total sales, that's good enough in practice.
Q. Do I need to run this check every month? No. Once the definitions are aligned, you only need to watch matching from then on. Revisit it only in two cases: a month with lots of new products, and a month when you add a new channel.
Closing thoughts
The moment you stop trusting a dashboard isn't when a number is wrong — it's when you can't explain why it's different. Once you know the names of the four layers, you can look at a difference and say what caused it, and from then on the dashboard stops being something to verify and becomes a tool.
Spend just 30 minutes today — start by aligning the time basis, and most of the difference will disappear right there.
The figures in this report are not actual transaction data; they are illustrative values generated to reflect the distribution of Laplace benchmark metrics. They are not the actual figures of any specific customer, so please use them to understand trends rather than as absolute values. Figures from public research are cited with their sources in each item. Screen names and setting names may differ slightly depending on the release.