Your real-time view doesn't show all your sales — hourly data from 6 brands
We broke down order data from 6 brands by the hour. The share of sales that shows up in real time ranged from 29.8% to 9
We broke down order data from 6 brands by the hour. The share of sales that shows up in real time ranged from 29.8% to 98.7%.
Live commerce and flash deals are events where sales move by the minute, not by the hour. That is why people say "checking sales after the broadcast ends is too late." And the numbers back it up: a page that responds 100ms slower loses 7% of conversions (Akamai), and when mobile loading takes longer than 3 seconds, 53% of visitors leave (Google). Knowing a few minutes sooner is, in itself, a way of protecting revenue.
The figures in this report are not actual transaction data; they are illustrative values generated to reflect the distribution of Laplace benchmark metrics. They are not the actual figures of any specific customer, so please use them to understand trends rather than as absolute values.
PART 1. What the real-time view can see differs by brand
Real-time analysis only works if each order carries a timestamp. But not every channel provides one. Marketplace fulfillment and offline or wholesale channels commonly pass orders along batched by day, and all of those orders pile up at midnight.
For the 6 brands, we split channels into those whose orders "pile up at midnight" and those whose timestamps are actually spread across the day.
| Range of sales share captured in real time | Median across the 6 brands | Brands where less than half of sales is visible in real time |
|---|---|---|
| 29.8–98.7% | 82.6% | 2 of 6 |
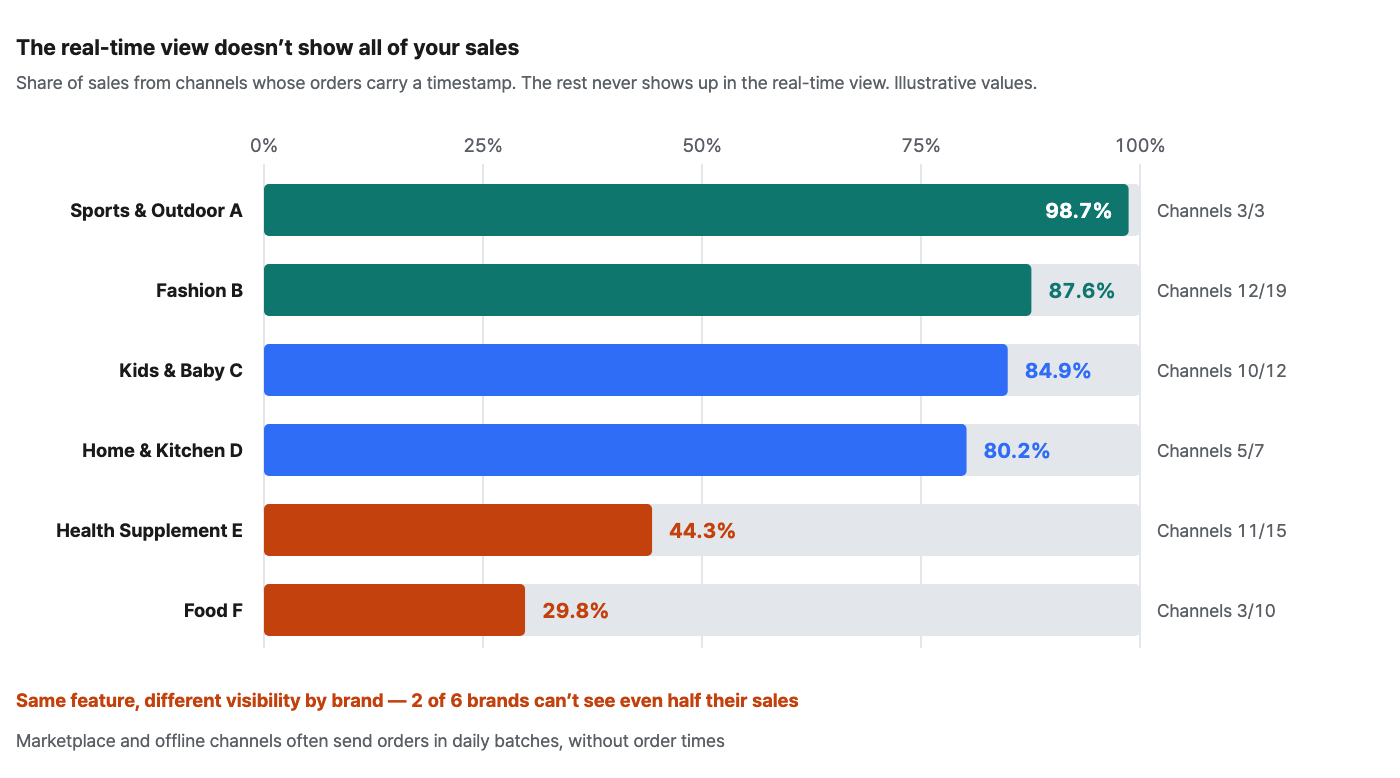
Food Brand F gets timestamps from only 3 of its 10 channels, and those channels generate just 29.8% of its sales. When this brand opens its real-time view, it is looking at a screen that misses 70% of its revenue. Health Supplement Brand E is in a similar position at 44.3% — its structure leans heavily on marketplace fulfillment.
By contrast, Fashion Brand B, Kids & Baby Brand C and Home & Kitchen Brand D, which sell largely through their own store, see 80.2–87.6% of sales arrive in real time. Turn on the same feature, and each brand sees a different world.
So the first step is not to switch the view on, but to measure what it can see. Lay out your order data by the hour and check how much of your sales piles up at midnight. That portion will never appear in the real-time view. If visibility is narrow, use real time as a tool for your own store only and make company-wide sales calls on a daily basis — the biggest danger is mistaking half a picture for the whole.
Where to look in Laplace — Dashboard > Sales > Sales by Period
PART 2. A day is less compressed than you think
We turn on the real-time view on the premise that "events compress time." But unless you know how compressed an ordinary day is, you can't tell whether the number on screen is an event effect or just what that hour normally looks like.
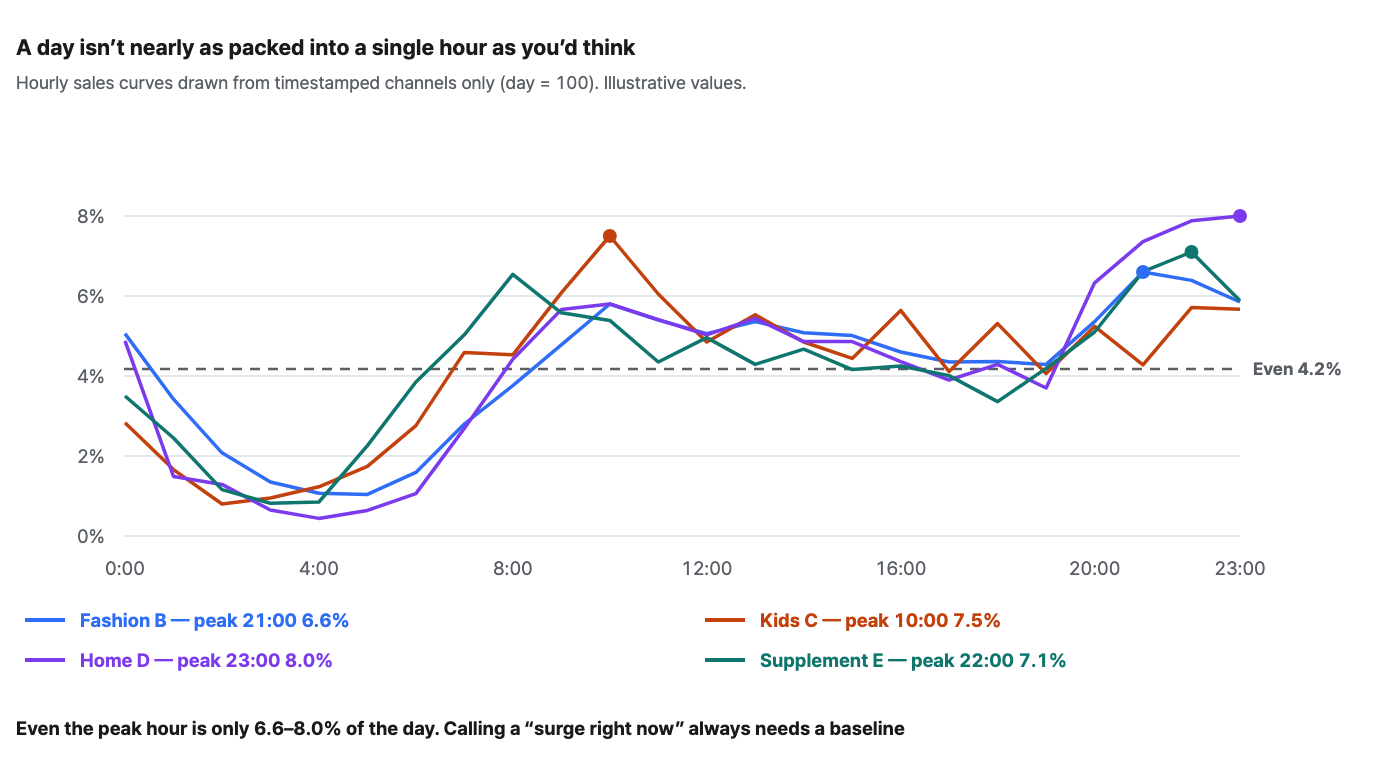
For all four brands, the peak hour accounts for 6.6–8.0% of the day. Split a day evenly across 24 hours and each hour gets 4.2%, so even the peak is only about 1.6–1.9 times the average. The curves look alike, too — they bottom out before dawn, rise in the morning, stay fairly flat through the day, and climb once more between 9 and 11 p.m.
| Brand | Peak hour | Busiest 1 hour | Top 3 hours | Overnight 0–6 a.m. | Days observed |
|---|---|---|---|---|---|
| Sports & Outdoor Brand A | 13:00 | 12.4% | 34.3% | 1.2% | 7 days |
| Fashion Brand B | 21:00 | 6.6% | 18.8% | 14.0% | 31 days |
| Kids & Baby Brand C | 10:00 | 7.5% | 19.6% | 9.2% | 30 days |
| Home & Kitchen Brand D | 23:00 | 8.0% | 23.1% | 9.4% | 31 days |
| Health Supplement Brand E | 22:00 | 7.1% | 20.3% | 11.0% | 30 days |
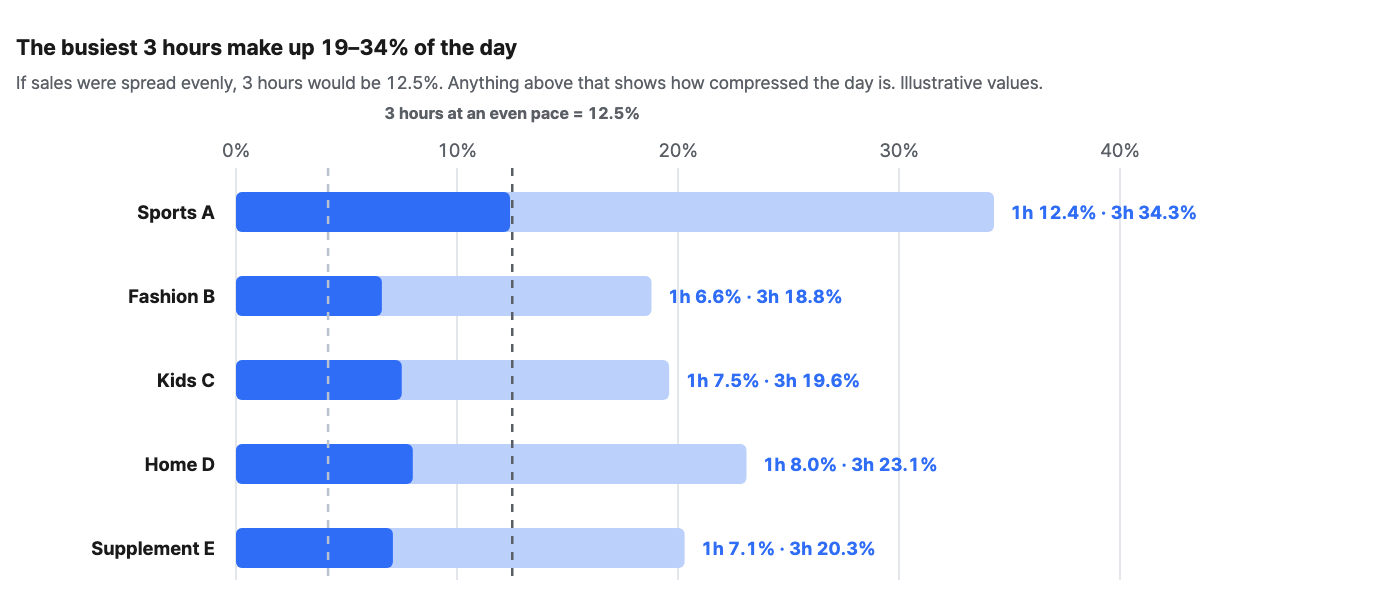
There is one exception. Sports & Outdoor Brand A is clearly spikier, with 12.4% in its busiest hour and 34.3% in its top 3 hours. But this brand has only 3 channels and just 7 days of observations — at small scale, a day is decided by a handful of orders, so it naturally looks spiky. That is why you need to check sample size before reading compression as an event effect.
So any judgment that "orders are surging right now" needs a baseline. A jump in orders at 10 p.m. may not be the event at all — that hour may simply be your normal peak. The comparison should be either the usual curve for the same weekday and hour or the same elapsed point in a past event. Comparing clock time against clock time is neither.
Where to look in Laplace — Dashboard > Sales > Sales by Period
PART 3. Most of the "real-time vs. confirmed" difference is VAT
The numbers in the real-time view are preliminary figures, so they differ from confirmed sales. People often say the difference is "usually 5–15%." We broke down what that difference actually consists of.
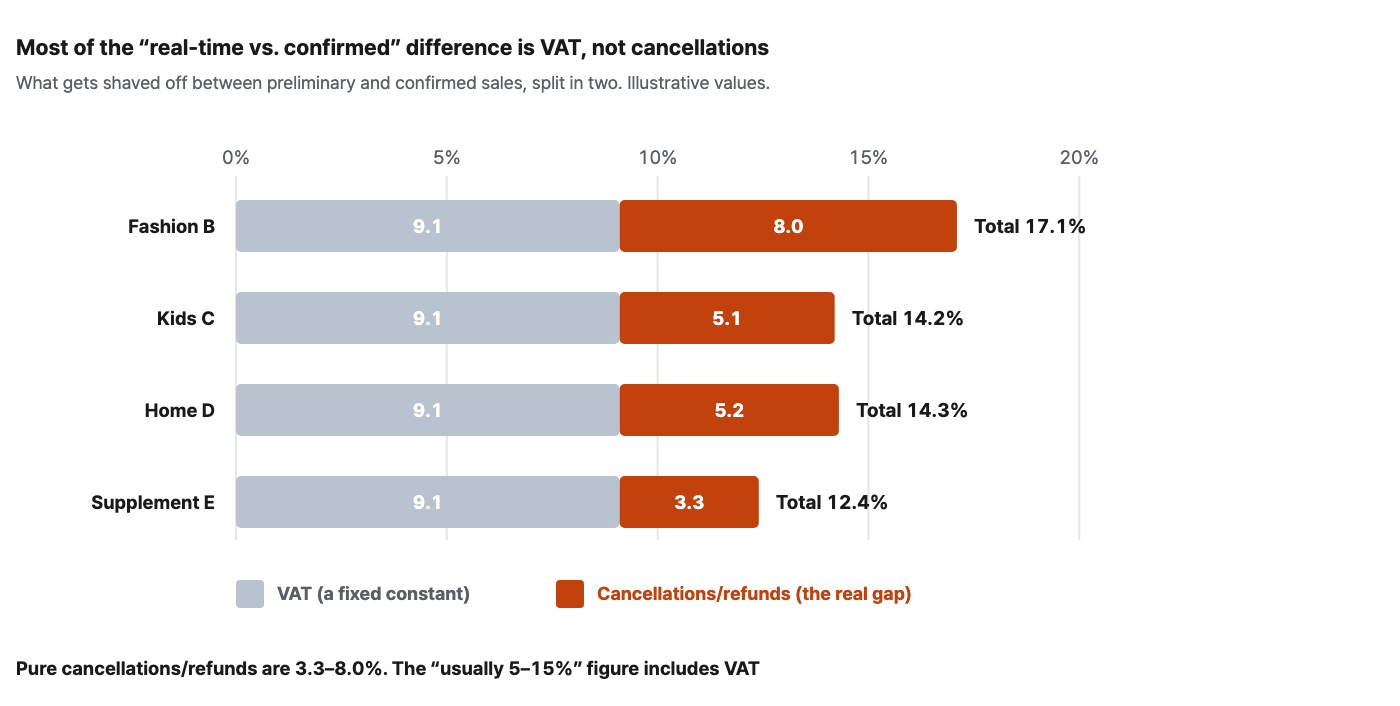
The result is clear. Pure cancellations and refunds account for only 3.3–8.0%, and the remaining 9.1pp is VAT. Combined, they come to 12.4–17.1% — that is what the commonly quoted "5–15%" really is. More than half the difference was not cancellations but tax.
| Brand | VAT | Cancellations/refunds | Total gap | Cancellations/refunds p90 |
|---|---|---|---|---|
| Fashion Brand B | 9.1% | 8.0% | 17.1% | 15.3% |
| Kids & Baby Brand C | 9.1% | 5.1% | 14.2% | 10.5% |
| Home & Kitchen Brand D | 9.1% | 5.2% | 14.3% | 9.3% |
| Health Supplement Brand E | 9.1% | 3.3% | 12.4% | 6.2% |
In practice this distinction matters because the two behave differently. VAT is a constant, so you can simply subtract it up front, but cancellations and refunds vary from day to day. Fashion Brand B has a median of 8.0%, yet on its top 10% of days the figure widens to 15.3%. Lump it all together as "our gap is roughly 15%," and you miss the part that genuinely fluctuates.
Align the VAT basis when you measure. If only one of order sales and confirmed sales includes VAT, even a brand with almost no cancellations will show a 9.1% gap. That is exactly what happened with our own first measurement — two brands came out at precisely 9.1%, and we briefly wondered whether their cancellations were "exactly that much." When we aligned VAT and measured again, both came out at 0%. These were brands whose cancellations and refunds never made it into the data at all.
PART 4. "The gap widens during promotions" was not in the data
There is a frequently cited rule: promotions drive impulse buying, which increases cancellations and refunds, so any "sales target hit!" report right after an event should allow for the gap. It sounds plausible. We checked it against 397 days of data.
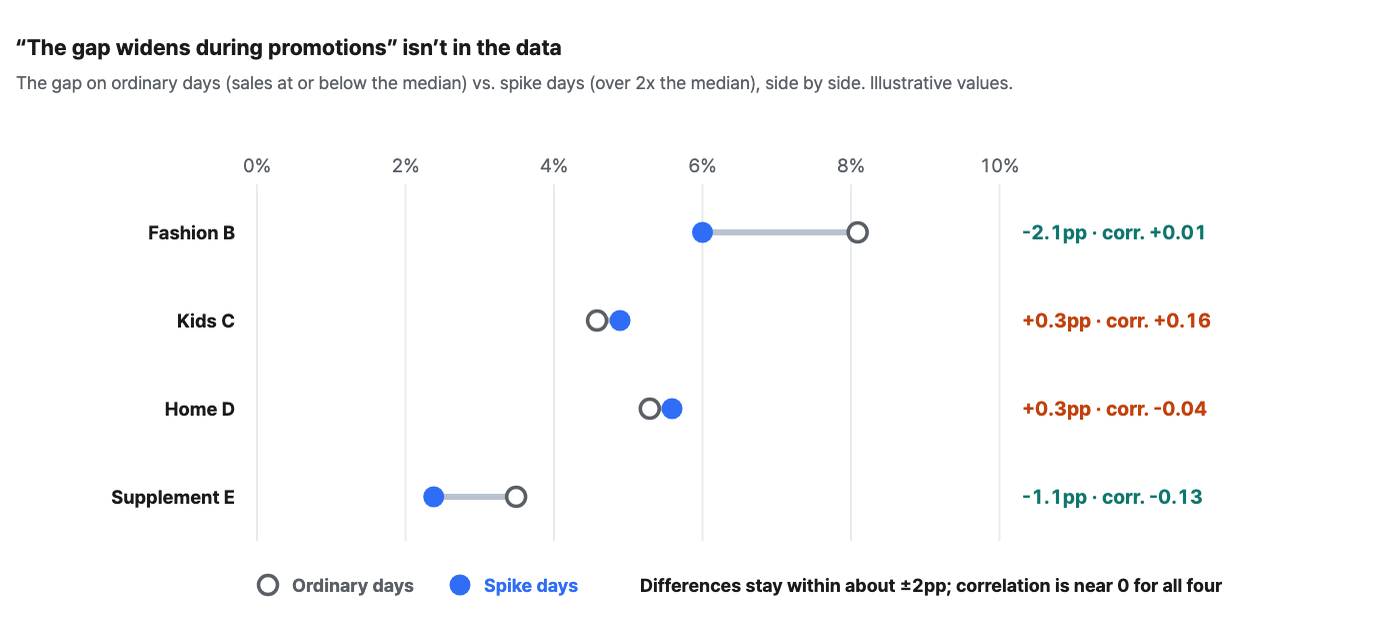
There is no relationship. The correlation between sales rank and gap rank ranges from -0.13 to +0.16, close to 0 for all four brands, and the difference in gap between spike days (days when sales exceeded twice the median) and ordinary days is only -2.1pp to +0.3pp. In fact, at 2 brands the gap got smaller on spike days.
Here is how we read it. Sales on spike days are usually planned promotions, and on those days inventory, pricing and shipping conditions have been sorted out in advance. Cancellations on ordinary days, on the other hand, happen constantly — stockouts, wrong shipments, simple changes of mind. It's not so much that events increase cancellations; cancellations are always there.
That doesn't mean it's fine to judge performance on preliminary figures. The gap doesn't grow especially large on spike days, but its size of 12.4–17.1% stays the same. What changes is how you respond — instead of "it's a promotion, so more will be shaved off, let's be conservative," simply treat your usual gap ratio as a constant and convert the preliminary figure directly. That is more accurate.
PART 5. So how do you run it?
Translate the four findings above directly into operating rules, and you get this.
| Situation | What to do with the real-time view | What to prepare in advance |
|---|---|---|
| Live broadcast | Watch only three things: visits (traffic), order conversion (conversion), and the same elapsed point in the previous broadcast (comparison) | Curves by elapsed time from past broadcasts. Without them, you have nothing to compare against |
| Promotion launch | Visits hold steady while orders alone drop off = an early warning of checkout, inventory or page errors | Usual order levels for the same hour (the curves in Figure 2) |
| Ordinary days | Anomaly detection against the hourly baseline | Hourly curves for the last 30 days. Keeping a separate one for each weekday is even more accurate |
| After the event | Not a job for real time | Convert using your usual gap ratio (12.4–17.1%), then confirm against confirmed sales |
4 steps before turning on real time
-
Measure your visibility. Break sales down by the hour and check what share piles up at 00:00. If that share is more than half, real time is best used as a tool for your own store only.
-
Build a baseline. Save a screenshot of your hourly curves for the last 30 days. Without it, the numbers in the real-time view cannot be interpreted.
-
Derive your gap ratio as a constant. Split VAT from cancellations and refunds and measure each as a percentage, and you can convert preliminary figures into confirmed sales on the spot, even mid-event.
-
Assign response authority. Who handles coupons, who handles broadcast cues, who checks the pages. With detection but no authority to respond, your war room becomes a spectator gallery.
Summary
-
Measure what your real-time view can see first. Across 6 brands, the share of sales captured in real time ranged from 29.8% to 98.7%, and at 2 brands less than half was visible.
-
An ordinary day is not heavily compressed. The peak hour is 6.6–8.0% of the day (an even split would be 4.2%). Any judgment that "orders are surging now" requires a baseline.
-
At small scale, things naturally look spiky. The brand with only 7 days of observations looked the most compressed — check your sample before reading compression as an event effect.
-
Most of the difference between preliminary and confirmed figures is VAT. Pure cancellations and refunds are 3.3–8.0%; VAT is 9.1pp. If the VAT basis isn't aligned, even a brand with no cancellations will show a 9.1% gap.
-
We found no relationship between spike days and a wider gap. Correlation -0.13 to +0.16, difference -2.1 to +0.3pp. The gap behaves less like an event variable and more like a constant.
Frequently asked questions
Q. How do I monitor channels the real-time view doesn't capture?
You can't, not in real time. Those channels come in by the day, so they belong to daily alerts. Split the roles — your own store and timestamped channels go on the real-time view, everything else goes to daily anomaly detection. Trying to see everything on one screen and mistaking half a picture for the whole is the bigger risk.
Q. How often should I refresh the baseline?
Once a quarter is enough. But when your channel mix changes, redraw it immediately. Adding even one channel without timestamps changes not the shape of the curve but your visibility itself.
Q. Is there no way to know confirmed sales during an event?
No. Cancellations and refunds trickle in over several days. Instead, multiply by your usual gap ratio to convert and you will be fairly accurate — in this analysis the gap on spike days was the same as usual, which means the conversion holds even mid-event.
Q. How far should I react to minute-by-minute swings?
Don't react to any single point in time. Short windows have small samples, so they naturally bounce around. The case of Sports & Outdoor Brand A above is exactly this problem — the smaller the scale, the spikier it looks. Make decisions only on trends over several minutes and against a baseline.
References: Akamai performance and conversion research · Google mobile speed research
The figures in this report are not actual transaction data; they are illustrative values generated to reflect the distribution of Laplace benchmark metrics. They are not the actual figures of any specific customer, so please use them to understand trends rather than as absolute values. Figures from public research are cited with their sources in each item. Screen names and setting names may differ slightly depending on the release.