Ask Claude or ChatGPT about your Cafe24, Coupang and SmartStore data: promo, inventory and repeat-purchase strategy with the Laplace MCP
Plenty of marketers know this Black Friday story. You open the morning with big ads behind your hero product, and two da
Plenty of marketers know this Black Friday story. You open the morning with big ads behind your hero product, and two days later the stock runs out and the ads have to come down. Settlement after the sale can be even more of a shock. Product A sold 1,000 units, yet once you take out sales commissions, the shipping you paid for free delivery, COGS and ad spend, it actually lost money.
This doesn't happen because the data is missing. Inventory lives in an inventory file, COGS in a cost sheet, commissions in each channel's settlement report and ad spend in the ad manager, so nobody could tie them together before the sale. More and more people ask Claude or ChatGPT these days, but when the data isn't connected, AI also stops at "Here is this month's contribution margin." This post walks through how far AI can go once you bring your data into Laplace and connect the relationships between it (the ontology), using three situations: promo inventory, loss-making products, and first versus repeat purchases.
What you'll learn
PART 01 · Collecting data alone leaves AI stuck at "What's my contribution margin?"
Laplace collects orders from sales channels such as Cafe24, Naver SmartStore and Coupang, plus ad spend from Meta, Google and Naver, every day. That is step one. With the data in one place, AI can instantly answer questions like "sales by channel last week" or "contribution margin this month."
To build a strategy, though, the data has to be connected. AI needs to know that Coupang's "Probiotics 30 sachets, buy one get one" and your own store's "Probiotics 2-box set" are the same product, that its COGS changed last month, which Meta ad creative sold it, and how many days of stock are left today. Only then can it say, "This product loses more money the more you sell it during a promo." In Laplace, this structure that defines how the data relates is called the ontology.
| Relationship to connect | Where to connect it in Laplace | What goes wrong if it's missing |
|---|---|---|
| Sales option ↔ Base product | Option ↔ Base product matching in Data Management | The same product is counted separately per channel and calculated without COGS |
| Base product ↔ COGS history | Base product | Margin and contribution margin look better than they really are |
| Brand and sales channel ↔ Sales commission | Commissions in Data Management | Commission is calculated as 0%, inflating contribution margin |
| Ad creative ↔ Product | Ad creative ↔ Product matching | Ad spend drops out of product-level contribution margin |
| Order ↔ Customer | Merge purchase history across sales channels to identify the same customer as one | First purchase, repeat purchase and LTV get skewed |
| Base product ↔ Inventory history | Inventory data connection (your account manager will help) | Expected sell-out dates can't be calculated from sales velocity |
| Base product ↔ Your own reference tables (order lead time, promo calendar, etc.) | Attach a Google Sheet with an ontology lookup | For values Laplace doesn't have, AI can only guess |
Every missing relationship quietly skews the numbers, and because the screen still shows perfectly normal-looking figures, that is all the more dangerous. In PART 04 you'll see how the same product's contribution margin flips from a loss to a profit depending on which connection is missing. Put the other way around, connecting relationships is how you raise data quality, and AI analysis only becomes trustworthy once data quality goes up.
So if you've just connected your data, ask for a check-up before any analysis.
"Using Laplace data, check data quality before we analyze anything. Look for options not linked to a base product, sales channels without a commission rate, and ad spend not attached to a product, and list them in order of impact on sales."
AI looks up unmatched options, commission history by sales channel, and ad rules that are losing ad spend because no category is attached, then builds a list of fixes. If you ask it to match options to base products with similar names, it saves the matches too, and every change is recorded in the change history so you can roll it back.
PART 02 · Simple lookups vs. connected questions
Before relationships are connected, one question is answered by one dataset. Once they're connected, several datasets move together behind a single question.
| What people usually ask today | What you can ask once relationships are connected | Data combined |
|---|---|---|
| "What was last month's contribution margin?" | "Break down the products with negative contribution margin during Black Friday by channel and discount rate, and show me where the money is leaking" | Orders, COGS, commissions, seller-paid shipping, ad spend by product, discounts and coupons |
| "How many units of Product B are left?" | "Based on the sales velocity from our last promo, how many days until Product B sells out, and when and how much should we reorder given the lead time?" | Inventory history, promo notes, daily units sold, lead time sheet |
| "What's Product B's ROAS?" | "Pull the ads running on products with less than 5 days of stock left, plus their ad spend for the last 7 days" | Inventory history, ad creative ↔ product matching, ad spend |
| "What's our repurchase rate?" | "Compare 90-day repurchase rate, repurchase cycle and 12-month cumulative contribution margin by first-purchase product, and pick the products to put a first-purchase coupon on" | Customer identity, first-purchase product, cohorts, contribution margin |
| "How much revenue came from coupons?" | "For each coupon, show the number of first-time customers, the share of them who bought again, and the contribution margin of coupon orders" | Coupon name, first vs. repeat purchase, contribution margin |
Done by hand, the questions on the right mean opening four or five files and spending half a day on VLOOKUPs. When the data is already connected, AI calculates them on the same basis in a few minutes. Let's go through three real situations one by one. The examples use a health supplement brand.
PART 03 · Keep your ads running past day two of a promo (inventory ↔ sales velocity ↔ ads)
The situation
For a 7-day Black Friday promo, a multivitamin (Product B) was the hero product. There were 900 units in stock and it normally sells 90 a day, so 10 days of stock looked comfortable. Once the promo started, sales jumped to 4 times the usual pace and it sold out in 2.5 days. For the remaining four and a half days the main ads stayed off, and the product page showed nothing but a sold-out label.
The problem was looking only at days of stock at normal pace. Promo sales velocity, the time it takes for a reorder to arrive, and the ads attached to the product were never seen together.
What needs to be connected
-
Inventory history Inbound, outbound, ending stock, average daily outbound, standard deviation of outbound and days of stock pile up daily for each base product.
-
Sales option ↔ Base product Even when buy-one-get-one or bundle listings sell, sales velocity is only right if they are converted into how many base product units actually shipped.
-
Promo notes If you leave past promo periods as dashboard notes, AI finds those periods and compares them with normal days.
-
Ad creative ↔ Product Campaigns and creatives must be linked to Product B so you can immediately pick which ads to scale back.
-
Lead time sheet The days from placing an order to receiving stock aren't in Laplace, so you write them in a Google Sheet and attach them to base products with an ontology lookup.
Ask AI like this
-
"Using Laplace data, show current stock and days of stock for the 10 products going into next week's Black Friday promo. Also calculate how many times higher sales were than usual during last year's Black Friday note period, and tell me how many days until each sells out at that pace."
-
"Attach the lead time sheet to base products and calculate, for each product, the order quantity and order deadline needed to last the 7-day promo, including safety stock."
-
"For products whose reorder can't arrive before the promo, calculate how many units we can afford to sell per day, and pull the ads attached to them with their ad spend for the last 7 days. Then recommend products to shift ad budget to, based on days of stock and contribution margin rate."
-
"If any product drops below 3 days of stock during the promo, alert me on Slack every morning."
How AI combines the data
AI first finds the previous promo period from the promo notes, then compares base product sales in that period with normal days to get the sales multiplier. Next it takes current stock, average daily outbound and the standard deviation of outbound from inventory history to calculate the expected sell-out date, and uses the lead time attached by lookup to work out safety stock and order quantity. Finally it follows the ad creative ↔ product link to pull the campaigns and ad spend behind that product.
| Item (example calculation) | Value | Calculation |
|---|---|---|
| Normal daily outbound / outbound std. deviation | 90 units / 25 units | Inventory history |
| Current stock | 900 units | Inventory history (10 days at normal pace) |
| Sales multiplier in last promo | 4x | Promo note period vs. normal days |
| Expected daily sales during promo | 360 units | 90 units × 4 |
| Days current stock will last | 2.5 days | 900 units ÷ 360 units |
| Order lead time | 5 days | Lead time sheet lookup |
| Safety stock | 370 units | 1.65 × (25 units × 4) × √5 days ≈ 369 units |
| Stock needed for a 7-day promo | 2,520 units | 360 units × 7 days |
| Additional order quantity | 1,990 units | 2,520 units + 370 units − 900 units |
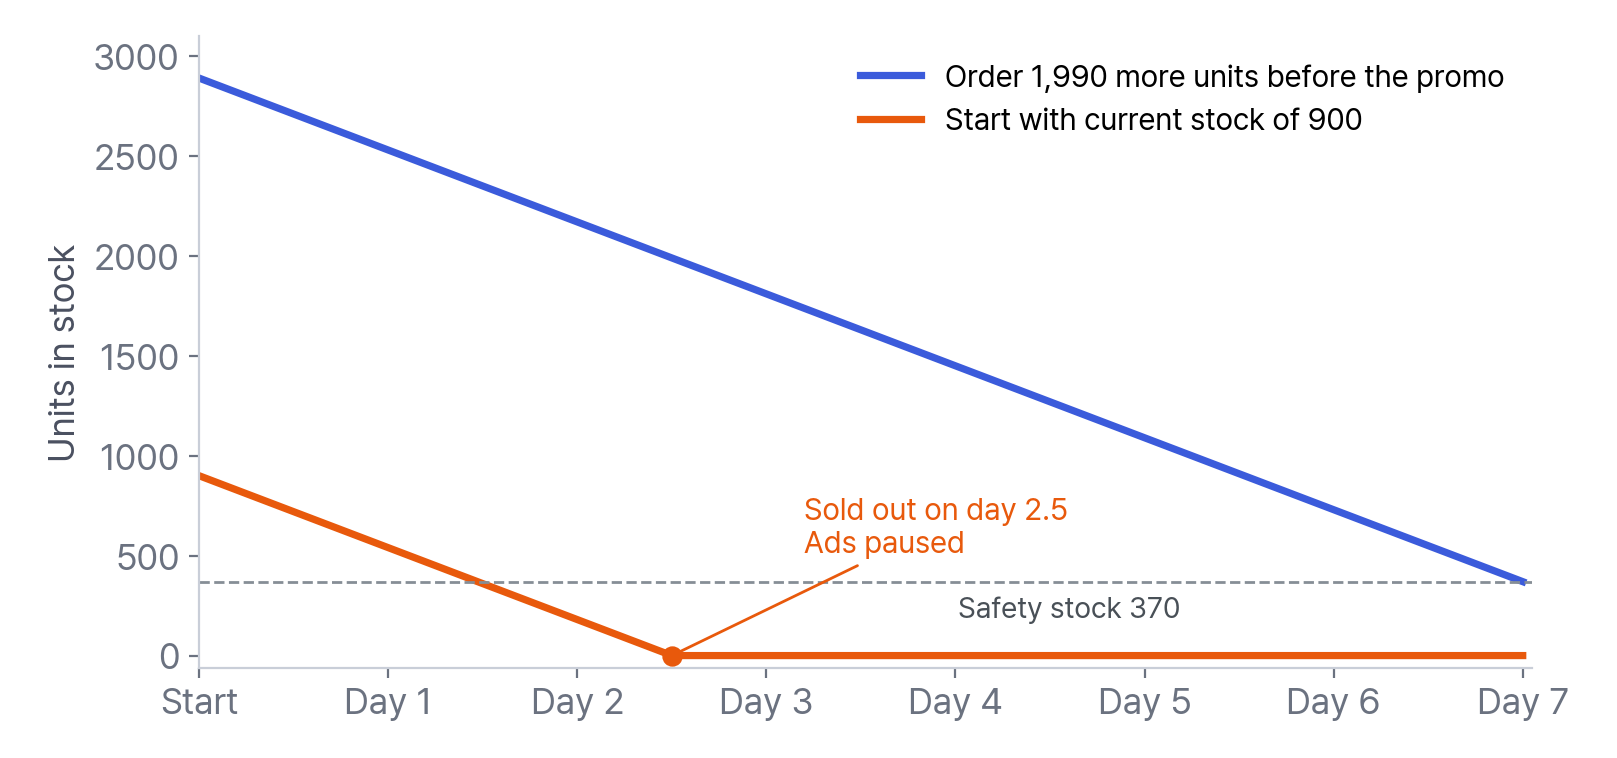
The 1.65 used for safety stock is the common value when you aim for about a 95% chance of not running out. If you want to be more conservative, just ask AI to "recalculate at 99%."
The strategy you can build
-
Set reorder deadlines backward from the promo calendar. With a 5-day lead time, the last day to order is 5 days before the promo starts. Get a table of order deadlines by product two weeks before the promo, and MDs and marketers can work from the same sheet.
-
For products that can't be restocked in time, match ads to stock. In the example above, without a new delivery you can sell 530 units after holding back safety stock, which is about 76 a day over 7 days. That is below normal sales, so Product B should come out of the main ads and the budget should move to products with ample days of stock and a healthy contribution margin rate.
-
Watch the promo with alerts. Get a Slack alert when days of stock fall below your threshold and trim ad budget early, and "ads off after two days" becomes "managed right through the last day."
-
Leave a note when the promo ends. Record this promo's period and sales multiplier as a note, and AI will use a more accurate multiplier next time.
PART 04 · Find the product that sold 1,000 units on Black Friday and still lost money (product ↔ channel ↔ discount ↔ costs)
The situation
A 30-day probiotic (Product A) with a list price of KRW 39,000 was sold at 40% off, KRW 23,400, for Black Friday. It sold 1,000 units, KRW 23.4 million in revenue, and ranked first in sales. But after taking out sales commissions, the shipping the seller paid for free delivery, COGS and promo ad spend, it was KRW 674,000 in the red.
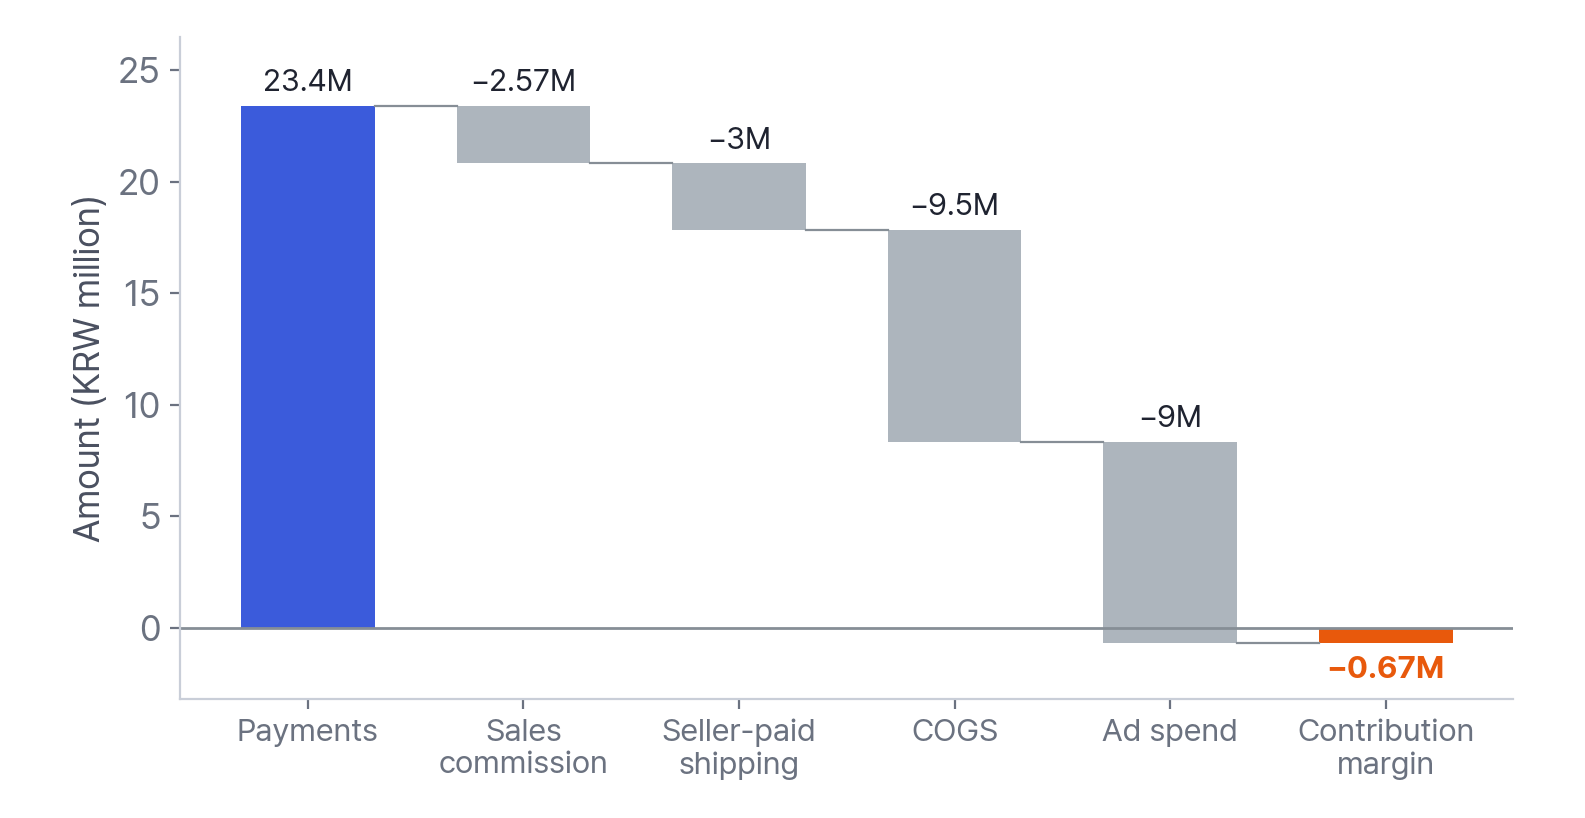
| Product A, 1,000 units (example calculation) | Per unit | Total |
|---|---|---|
| Payment amount (40% off the KRW 39,000 list price) | KRW 23,400 | KRW 23,400,000 |
| Sales commission (channel average 11%) | −KRW 2,574 | −KRW 2,574,000 |
| Seller-paid shipping | −KRW 3,000 | −KRW 3,000,000 |
| COGS | −KRW 9,500 | −KRW 9,500,000 |
| Promo ad spend | −KRW 9,000 | −KRW 9,000,000 |
| Contribution margin | −KRW 674 | −KRW 674,000 |
To keep it simple, VAT isn't separated out here. In Laplace, contribution margin is the payment amount minus COGS, ad spend, commissions and seller-paid shipping, calculated excluding VAT.
What has to be connected for this number to be right
Even for the same Product A, the contribution margin AI sees changes like this when one relationship is missing.
| Missing connection (example calculation) | Product A contribution margin as AI sees it | What's missing |
|---|---|---|
| Everything connected | −KRW 674,000 | Actual profit and loss |
| No commission set for the sales channel | +KRW 1.9 million | KRW 2.574 million in commissions is counted as zero |
| No ad creative ↔ product matching | +KRW 8.326 million | KRW 9 million in ad spend isn't attached to the product |
| No option ↔ base product matching | +KRW 8.826 million | KRW 9.5 million of COGS drops out |
Miss just one connection and a loss-making product looks like a star performer. Ask AI "Pick the products to push in our next promo" in that state, and it will give you a convincing answer built on the wrong numbers. That's why we say connecting relationships is data quality work.
Ask AI like this
-
"Using Laplace data, show the contribution margin of the top 20 products by units sold during Black Friday. Break down how much commission, seller-paid shipping, COGS and ad spend took out of the payment amount, and flag only the loss-making products."
-
"Split the loss-making products by channel. I want to see which channel lost money even for the same product."
-
"Divide Product A's discount and coupon amounts by product GMV to get the discount rate by date, then compare units sold and contribution margin per unit by discount-rate band."
-
"Based on current COGS, commission, shipping and ad spend, calculate the lowest selling price and the maximum discount rate at which Product A doesn't lose money."
How AI combines the data
AI merges orders from each channel at the base product level, takes COGS for the period from COGS history, rates from commission history by sales channel, and ad spend by product through ad creative ↔ product matching, then breaks down the contribution margin. Splitting it by channel reveals differences that the average was hiding.
| Channel (example calculation) | Units sold | Commission rate | Ad spend | Contribution margin |
|---|---|---|---|---|
| Own store (Cafe24) | 300 units | 4% | KRW 4.5 million | −KRW 1,510,800 |
| Marketplaces (Coupang, Naver SmartStore) | 700 units | 14% | KRW 4.5 million | +KRW 836,800 |
| Total | 1,000 units | 11% on average | KRW 9 million | −KRW 674,000 |
The own store, with its low commission, is the one losing money. The ad spend used to bring people to the own store was concentrated on 300 units, which came to KRW 15,000 per unit. Whether this own store loss is really a loss leads to the question in PART 05: if customers who came in on a first purchase buy again later, the first-purchase loss can be seen as the cost of acquiring a new customer.
Looking at it by discount rate shows the benchmark for your next promo.
| Discount rate (example calculation) | Selling price | Units sold | Ad spend | Contribution margin | Contribution margin per unit |
|---|---|---|---|---|---|
| 20% | KRW 31,200 | 550 units | KRW 6 million | +KRW 2,397,400 | +KRW 4,359 |
| 30% | KRW 27,300 | 750 units | KRW 7.5 million | +KRW 1,347,750 | +KRW 1,797 |
| 40% | KRW 23,400 | 1,000 units | KRW 9 million | −KRW 674,000 | −KRW 674 |
Assuming you sell 1,000 units and spend KRW 9 million on ads, the lowest selling price that avoids a loss is (shipping KRW 3,000 + COGS KRW 9,500 + ad spend per unit KRW 9,000) ÷ (1 − 11% commission) = about KRW 24,157. In other words, a discount of about 38% off the list price is the limit.
The strategy you can build
-
Set a discount ceiling for each product in advance. Product A breaks even at a 38% discount, so allowing for commissions or ad spend creeping up, cap it at 35%. Under the same conditions, a 35% discount leaves about KRW 1,062 per unit.
-
Feature your top product by contribution margin, not by units sold. Give the main promo banner and ad budget first to the products that earn more the more they sell, not the ones that simply sell the most.
-
Rethink your free shipping threshold. Seller-paid shipping of KRW 3,000 per unit is a cost you can adjust before touching the discount rate. Switching to free shipping on 2 or more items lowers shipping cost per unit.
-
Save the product P&L table after the promo. Say "Add this table to a 'Black Friday wrap-up' dashboard," and you can compare on the same basis at the next promo.
PART 05 · Which product should open the first purchase, and how do you turn it into repeat purchases? (customer ↔ first-purchase product ↔ repeat purchase)
The situation
To grow new customers, you put a first-purchase coupon on three products. The trial pack was cheap, so first purchases came easily, but few customers actually came back. On the other hand, a product that lost money on the first purchase can end up earning more later. Looking at first-purchase revenue alone, you can't tell which is which.
What needs to be connected
-
Order ↔ Customer Purchase history across sales channels has to be merged so the same customer is identified as one; only then are first and repeat purchases accurate.
-
First-purchase product ↔ Later purchases For each first-purchase product, look at the share of customers who bought anything again (repurchase rate) and the days it took them (repurchase cycle).
-
Coupon name ↔ Order The coupon name left on each order shows which coupon brought in which customers.
-
Customer ↔ Contribution margin Laplace's cohort LTV is cumulative contribution margin divided by the number of customers in the cohort, so customer value is measured by the money left over, not by revenue.
Ask AI like this
-
"Using Laplace data, split first-time customers from the last 12 months by first-purchase product and compare the 90-day repurchase rate, average repurchase cycle and 12-month cumulative contribution margin per customer."
-
"For each first-purchase coupon, show the number of first-time customers, the contribution margin of their first orders, and the share who bought again within 90 days."
-
"Follow customers whose first purchase was probiotics and show what they bought second, and also tell me which products are often in the same cart."
-
"Save customers who first bought probiotics and haven't bought again as a segment. I also want to see how many days have passed since their first purchase."
How AI combines the data
AI uses cohort analysis for repurchase rate and cumulative contribution margin by first-purchase product, repurchase cycle analysis for the days until the next purchase, and flow and cross-purchase analysis for the second-purchase product and items bought together. Add the contribution margin of first orders split by coupon name, and you get a table like this.
| First-purchase product (example calculation) | First-purchase contribution margin per customer | 90-day repurchase rate | Average repurchase cycle | 12-month cumulative contribution margin per customer |
|---|---|---|---|---|
| Probiotics, 30-day supply (half-price trial coupon) | −KRW 6,000 | 38% | 31 days | +KRW 29,000 |
| Omega-3, 90-day supply (20% coupon) | +KRW 4,000 | 19% | 76 days | +KRW 11,000 |
| Vitamin C 7-day trial pack (KRW 9,900) | −KRW 2,000 | 12% | 47 days | −KRW 500 |
Judged by the first purchase, Omega-3 looks best. Over 12 months, though, the probiotics that lost KRW 6,000 on the first purchase leave KRW 29,000 per customer. The Vitamin C trial pack loses money on the first purchase and still hasn't paid back after a year.
Example calculation: how much first-purchase loss you can accept
The strategy you can build
-
Focus first-purchase coupons on probiotics. If you set the coupon amount and first-purchase ad spend within the acceptable first-purchase loss (KRW 20,000 per customer), you can also judge whether the own store loss in PART 04, driven by heavy ad spend, is an investment that pays back.
-
Send repeat-purchase coupons a week before the cycle. If the probiotics repurchase cycle is 31 days, build a segment so customers get a repeat coupon around day 24 after their first purchase.
-
Design the second purchase. If probiotics first-time customers often buy vitamin D next, make the repeat coupon a "probiotics + vitamin D set" and raise average order value at the same time.
-
Drop trial packs that never pay back as first-purchase bait. Use them instead as cross-sell items for existing customers.
PART 06 · Which channels and AI tools work with it?
What you can ask about matches the data you've connected to Laplace.
-
Sales channels Cafe24, Naver SmartStore, Coupang Wing, Coupang Rocket Growth, imweb, Godomall5, Kakao Shopping, Shopby, Toss Shopping and more
-
Ad channels Meta, Google Ads, Naver Search Ads, Naver GFA, Kakao Moment, TikTok Ads, Coupang Ads and more
-
Other data GA4, inventory data, and reference tables such as COGS and lead time (Google Sheets)
The Laplace guide covers the connection steps for each channel, and your account manager will help with channels that are harder to connect.
| AI tool | How it connects | Good to know |
|---|---|---|
| Claude (web and app) | Sign in with your Laplace account | Easiest to set up, so we recommend it if you're new |
| ChatGPT | Sign in with your Laplace account | Turn on developer mode in settings, then register it |
| Perplexity | Sign in with your Laplace account | Requires a paid Pro plan or higher |
| Claude Code · Cursor · VS Code | API key | Copy the command from the key issuance window and paste it to register |
| Gemini | API key | Works only in the developer Gemini CLI; the regular app and web aren't supported yet |
Please check the plan requirements too. MCP is available on the Growth, Pro and Enterprise plans and not on the Starter plan. During the free trial you can use up to 100 calls. The plan is checked against the project owner, so invited members follow the owner's plan.
PART 07 · How to connect Claude and ChatGPT
Both services only need the MCP server URL.
Claude (web and app)
-
In Settings, go to Connectors and click Add custom connector. Enter Laplace as the name and https://gateway.laplacetec.com/mcp as the server URL.
-
Click Connect, press Allow Access on the Laplace sign-in screen, and sign in with the account you normally use for Laplace.
-
In a new chat, open the + button and check that Laplace is turned on under Connectors.
ChatGPT
-
In Settings, turn on developer mode under Security and login.
-
Under Plugins, open Browse plugins, click the + button, and create a plugin named Laplace with the server URL https://gateway.laplacetec.com/mcp and OAuth as the authentication method.
-
Press Allow Access on the Laplace sign-in screen and sign in with your Laplace account.
Once connected, try sending "Show me my Laplace projects." If your project names appear, the connection is working. Start your questions with "Using Laplace data" so AI looks up the connected data first, and for long periods it's faster to ask in chunks of 90 days or less.
If you signed up for Laplace with Google, sign in with Google when connecting too; if you signed up with email, use email. Signing in a different way can hide your data or show a different project.
PART 08 · Security and troubleshooting
-
AI uses the Laplace permissions of the person who connected it, exactly as they are. Data you can't see in Laplace can't be queried by AI either, and personal information such as buyer names, phone numbers and addresses can't be queried.
-
Read-only lookups are the default, and changes such as matching or dashboards happen only when you ask. Every change is recorded in the change history so you can roll it back.
-
Results AI looks up are passed into the conversation of the AI service you're using and follow that service's data policy. Please connect with an account that fits your company's AI usage policy.
-
If AI answers without using Laplace data, check that Laplace is turned on in Connectors and start your question with "Using Laplace data."
-
If you see "Plan upgrade required" or "Trial ended," switch to the Growth plan or higher. If you're not the project owner, ask the owner.
-
If the connection drops or you get an authentication error, disconnect the connector and connect again. If you connected with an API key, issue a new key and register it again.
Before your next promo, hand AI one question
Collecting data alone only gets AI as far as "What's my contribution margin?" Connect the relationships between products, COGS, commissions, ads, customers and inventory, and the same AI will design reorder deadlines, discount ceilings and first-purchase coupon products for you, with the reasoning behind them. Before your next promo, start with one sentence: "Calculate days of stock and the discount ceiling for the products going into the promo."
The Laplace MCP getting started guide covers the connection steps in detail, and the MCP page lists what you can do along with example prompts.
👉 Read the Laplace MCP getting started guide
The numbers, questions and conversations in this post are example calculations to make things easier to follow, not real customer data. Screen names and menu locations may differ slightly as Laplace and each AI service are updated.